Fig. 10.
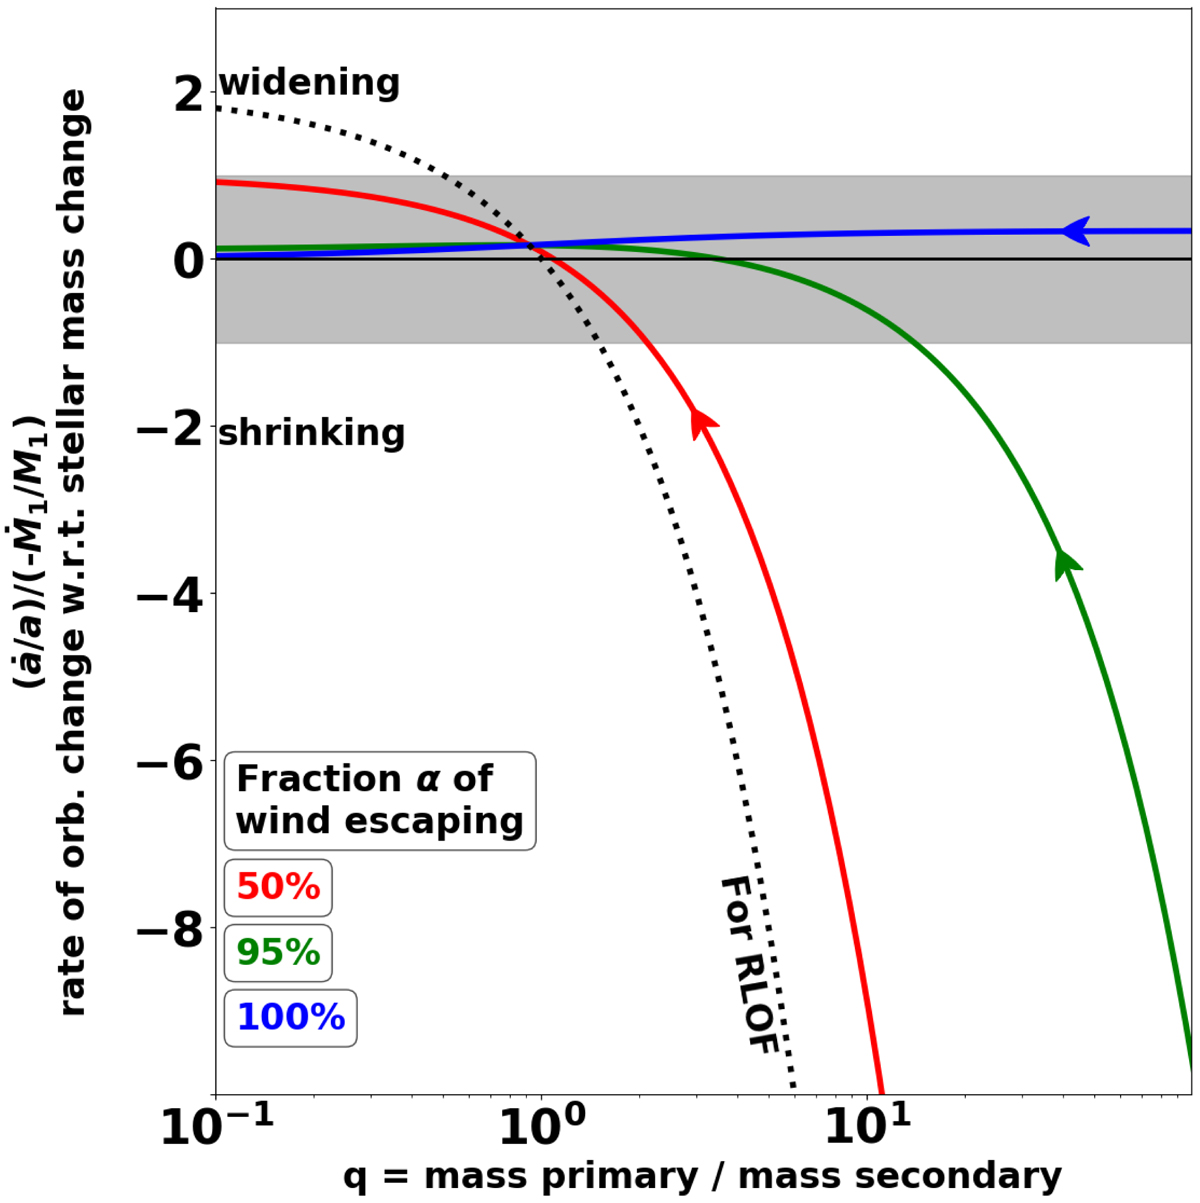
Rate of orbital separation change compared to the rate of stellar mass change. In the gray shaded region, the mass of the donor star changes faster than the orbital separation while above (resp. below) the orbit expands (resp. contracts). The two limit cases are conservative mass transfer (dotted line, RLOF) and pure mass loss without accretion by the secondary (solid blue line). In-between, the solid green and red lines are for an accretion efficiency by the secondary of 5% and 50%, respectively. The arrows indicate that as mass transfer proceeds, the mass ratio can only decrease.
Current usage metrics show cumulative count of Article Views (full-text article views including HTML views, PDF and ePub downloads, according to the available data) and Abstracts Views on Vision4Press platform.
Data correspond to usage on the plateform after 2015. The current usage metrics is available 48-96 hours after online publication and is updated daily on week days.
Initial download of the metrics may take a while.