Free Access
Fig. 12.
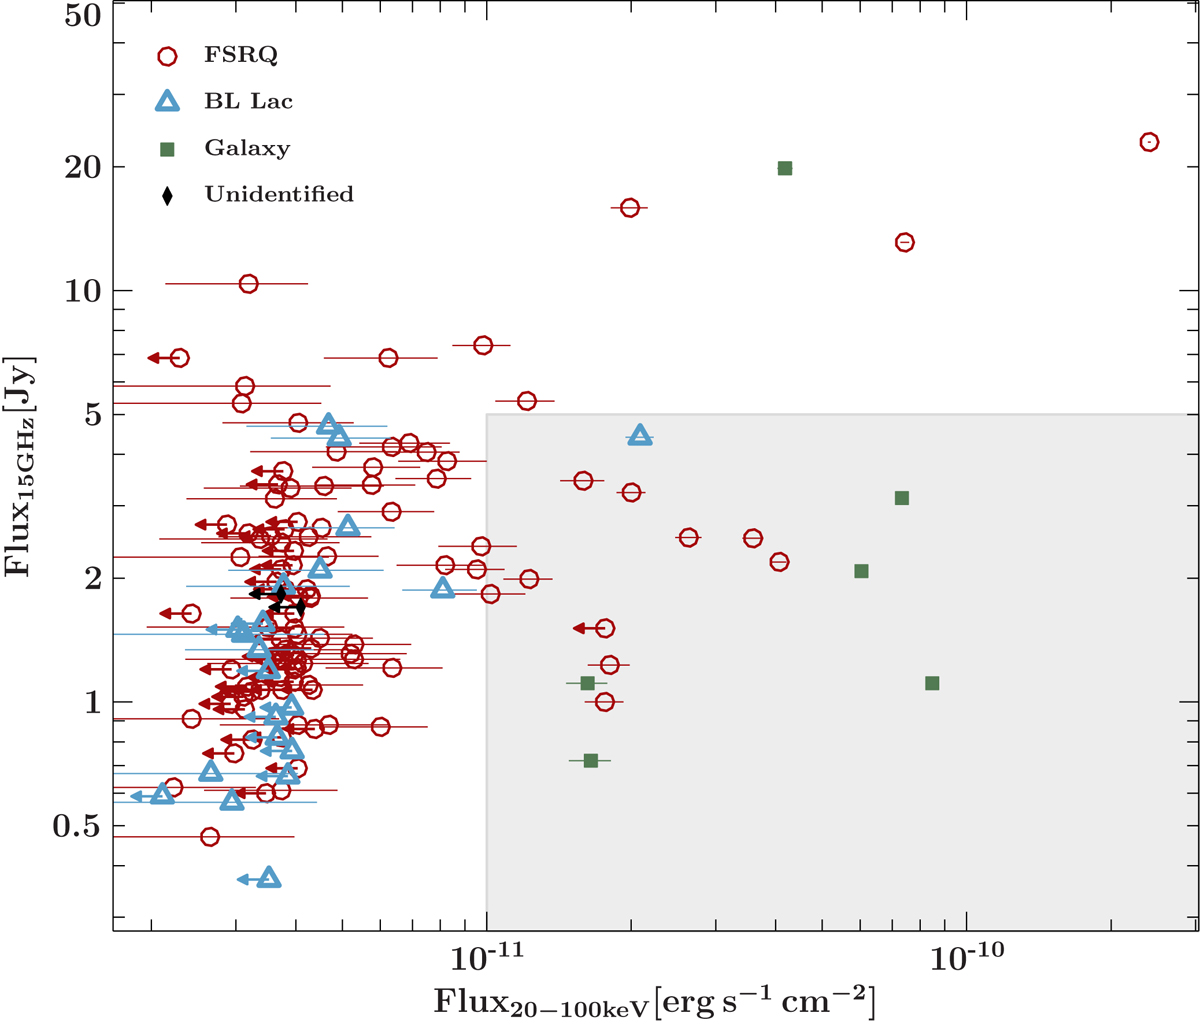
MOJAVE-1 sample: BAT 20 keV–100 keV flux plotted against 15 GHz flux density. The symbols with arrows to the left represent upper limit values. The shared area indicates a selected number of X-ray-bright while radio-faint sources (see text).
Current usage metrics show cumulative count of Article Views (full-text article views including HTML views, PDF and ePub downloads, according to the available data) and Abstracts Views on Vision4Press platform.
Data correspond to usage on the plateform after 2015. The current usage metrics is available 48-96 hours after online publication and is updated daily on week days.
Initial download of the metrics may take a while.