Fig. 11.
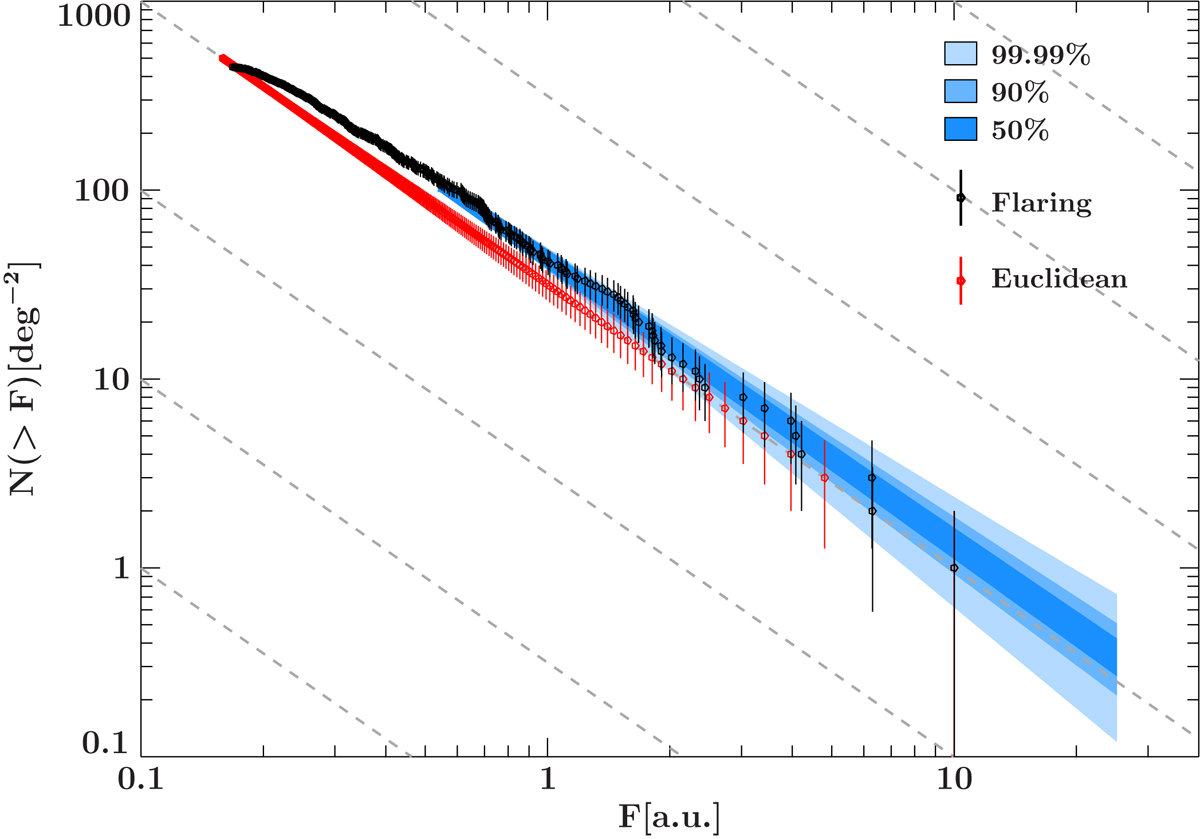
Simulated sample of sources with uniform luminosity and ideal Euclidean log N–log S flux distribution (red) and one instance of the same sample with random flaring (black, see text). The shaded areas indicate the error ranges derived by the Monte-Carlo approach, with 99.99% of all fitted power laws lying inside the outer shaded area.
Current usage metrics show cumulative count of Article Views (full-text article views including HTML views, PDF and ePub downloads, according to the available data) and Abstracts Views on Vision4Press platform.
Data correspond to usage on the plateform after 2015. The current usage metrics is available 48-96 hours after online publication and is updated daily on week days.
Initial download of the metrics may take a while.