Free Access
Fig. 3
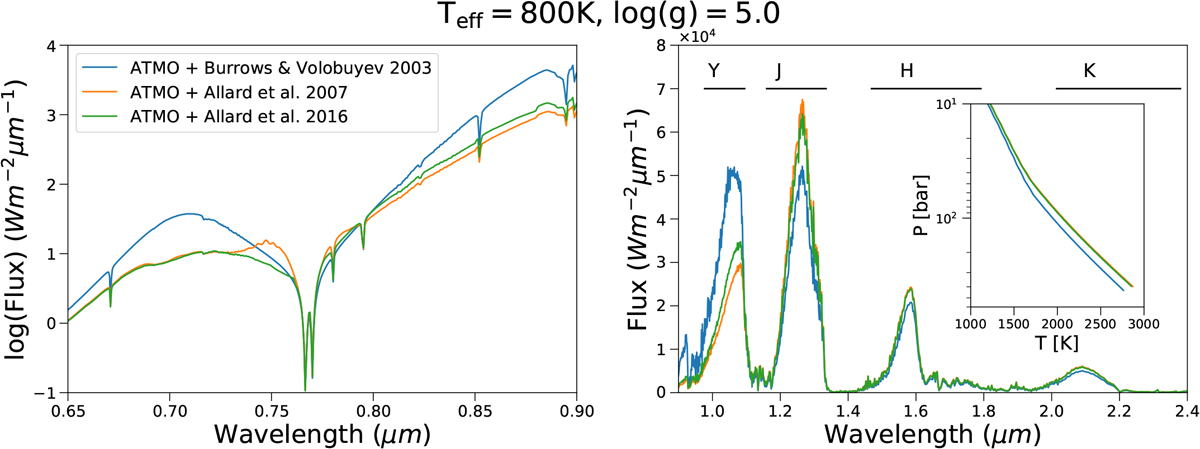
Comparison of the emission spectra from the top of the atmosphere for Teff = 800 K and log (g) = 5.0 calculated with alkali broadening from BV03; A07; A16. Right plot: locations of the Mauna Kea near-infrared filters.
Current usage metrics show cumulative count of Article Views (full-text article views including HTML views, PDF and ePub downloads, according to the available data) and Abstracts Views on Vision4Press platform.
Data correspond to usage on the plateform after 2015. The current usage metrics is available 48-96 hours after online publication and is updated daily on week days.
Initial download of the metrics may take a while.