Free Access
Fig. 3.
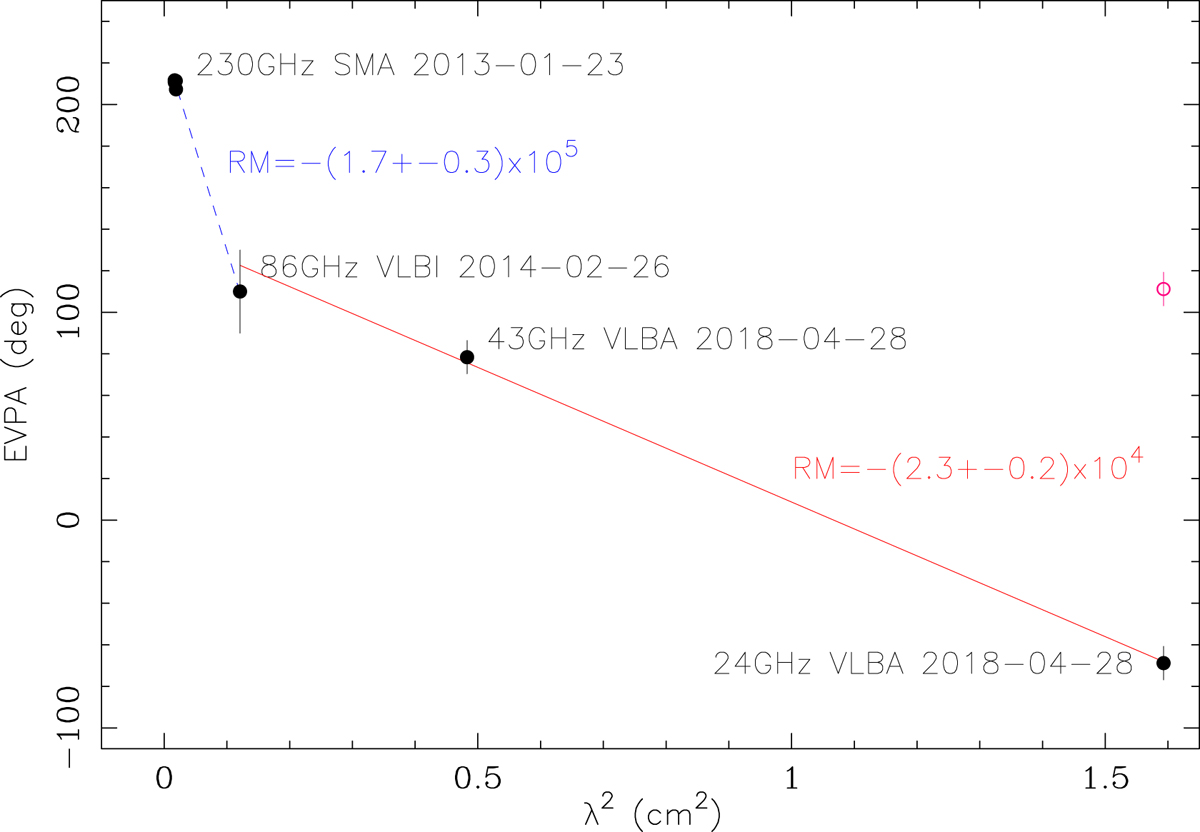
EVPA vs. λ2 and RM fit at the position of 0.1 mas downstream from the M87 radio core. The observed EVPA at 24 GHz is shown by the empty red circle, while the value rotated by −180°, for a better RM fit, is shown by the filled black circle at the same value of λ2.
Current usage metrics show cumulative count of Article Views (full-text article views including HTML views, PDF and ePub downloads, according to the available data) and Abstracts Views on Vision4Press platform.
Data correspond to usage on the plateform after 2015. The current usage metrics is available 48-96 hours after online publication and is updated daily on week days.
Initial download of the metrics may take a while.