Fig. 1.
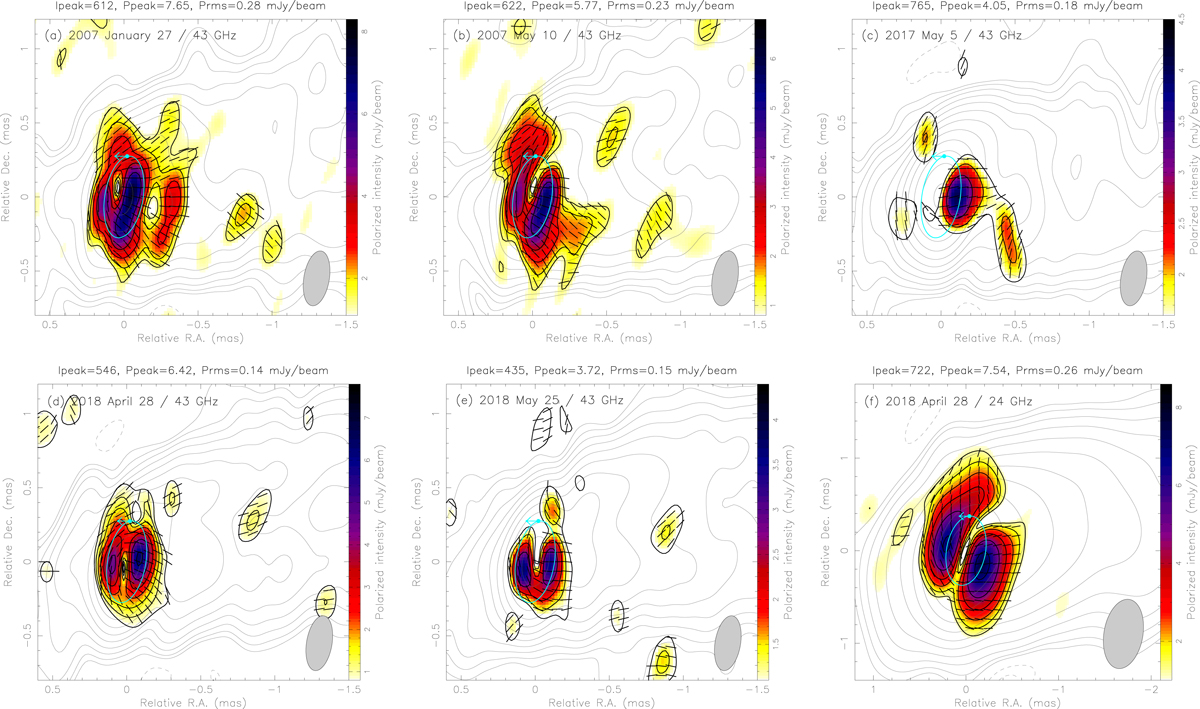
VLBA 24 GHz (f) and 43 GHz (a–e) polarimetric images of M87 in 2007–2018. The color map and black contours indicate the observed polarized intensity, vectors show the observed orientation of EVPA (uncorrected for Faraday RM), and gray contours denote the total intensity distribution. The synthesized beam is 0.76 × 0.42 mas at −10° at 24 GHz and 0.38 × 0.17 mas at −10° at 43 GHz, and is illustrated by the shaded ellipse. Stokes I contours increase by factors of 2, starting from 3.5 σrms, where σrms is 134 (a), 133 (b), 94 (c), 89 (d), 74 (e), and 128 (f) μJy beam−1. P contours start at 1.37 (a), 1.16 (b), 1.45 (c), 0.75 (d), 0.96 (e), and 1.17 (f) mJy beam−1, and increase by factors of ![]() . The blue ellipse specifies the region for which distributions (Figs. 2 and 3) have been computed, and the arrow indicates the start point and direction used for this analysis.
. The blue ellipse specifies the region for which distributions (Figs. 2 and 3) have been computed, and the arrow indicates the start point and direction used for this analysis.
Current usage metrics show cumulative count of Article Views (full-text article views including HTML views, PDF and ePub downloads, according to the available data) and Abstracts Views on Vision4Press platform.
Data correspond to usage on the plateform after 2015. The current usage metrics is available 48-96 hours after online publication and is updated daily on week days.
Initial download of the metrics may take a while.