Fig. 20.
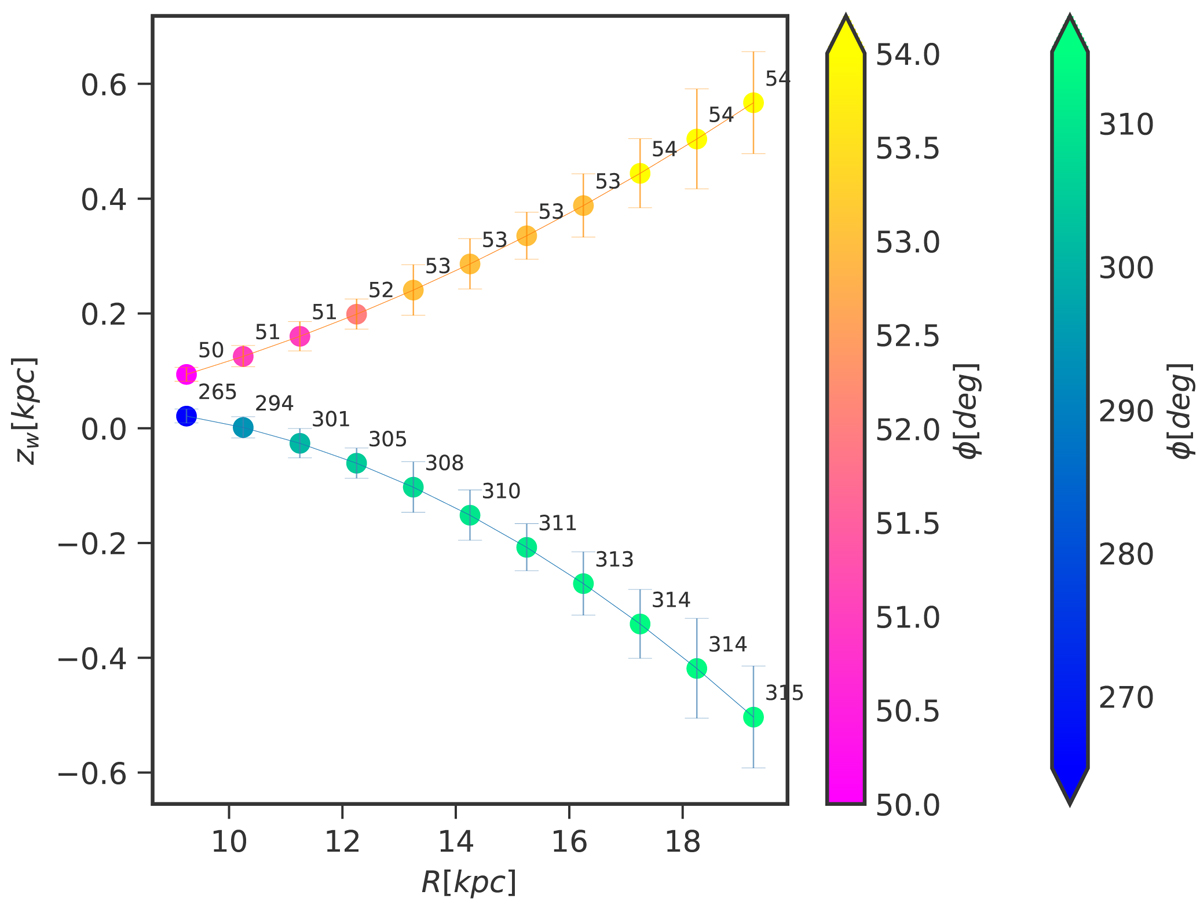
Minimum and maximum of the average elevation of the plane as a function of the Galactocentric distance. The warp fit is based on Eq. (13). The colours code the azimuth of the minimum and the maximum of the warp fit. The dataset containing a young population of stars is considered, and the error bars represent the uncertainty on the distance in the Lucy method.
Current usage metrics show cumulative count of Article Views (full-text article views including HTML views, PDF and ePub downloads, according to the available data) and Abstracts Views on Vision4Press platform.
Data correspond to usage on the plateform after 2015. The current usage metrics is available 48-96 hours after online publication and is updated daily on week days.
Initial download of the metrics may take a while.