Free Access
Fig. 10.
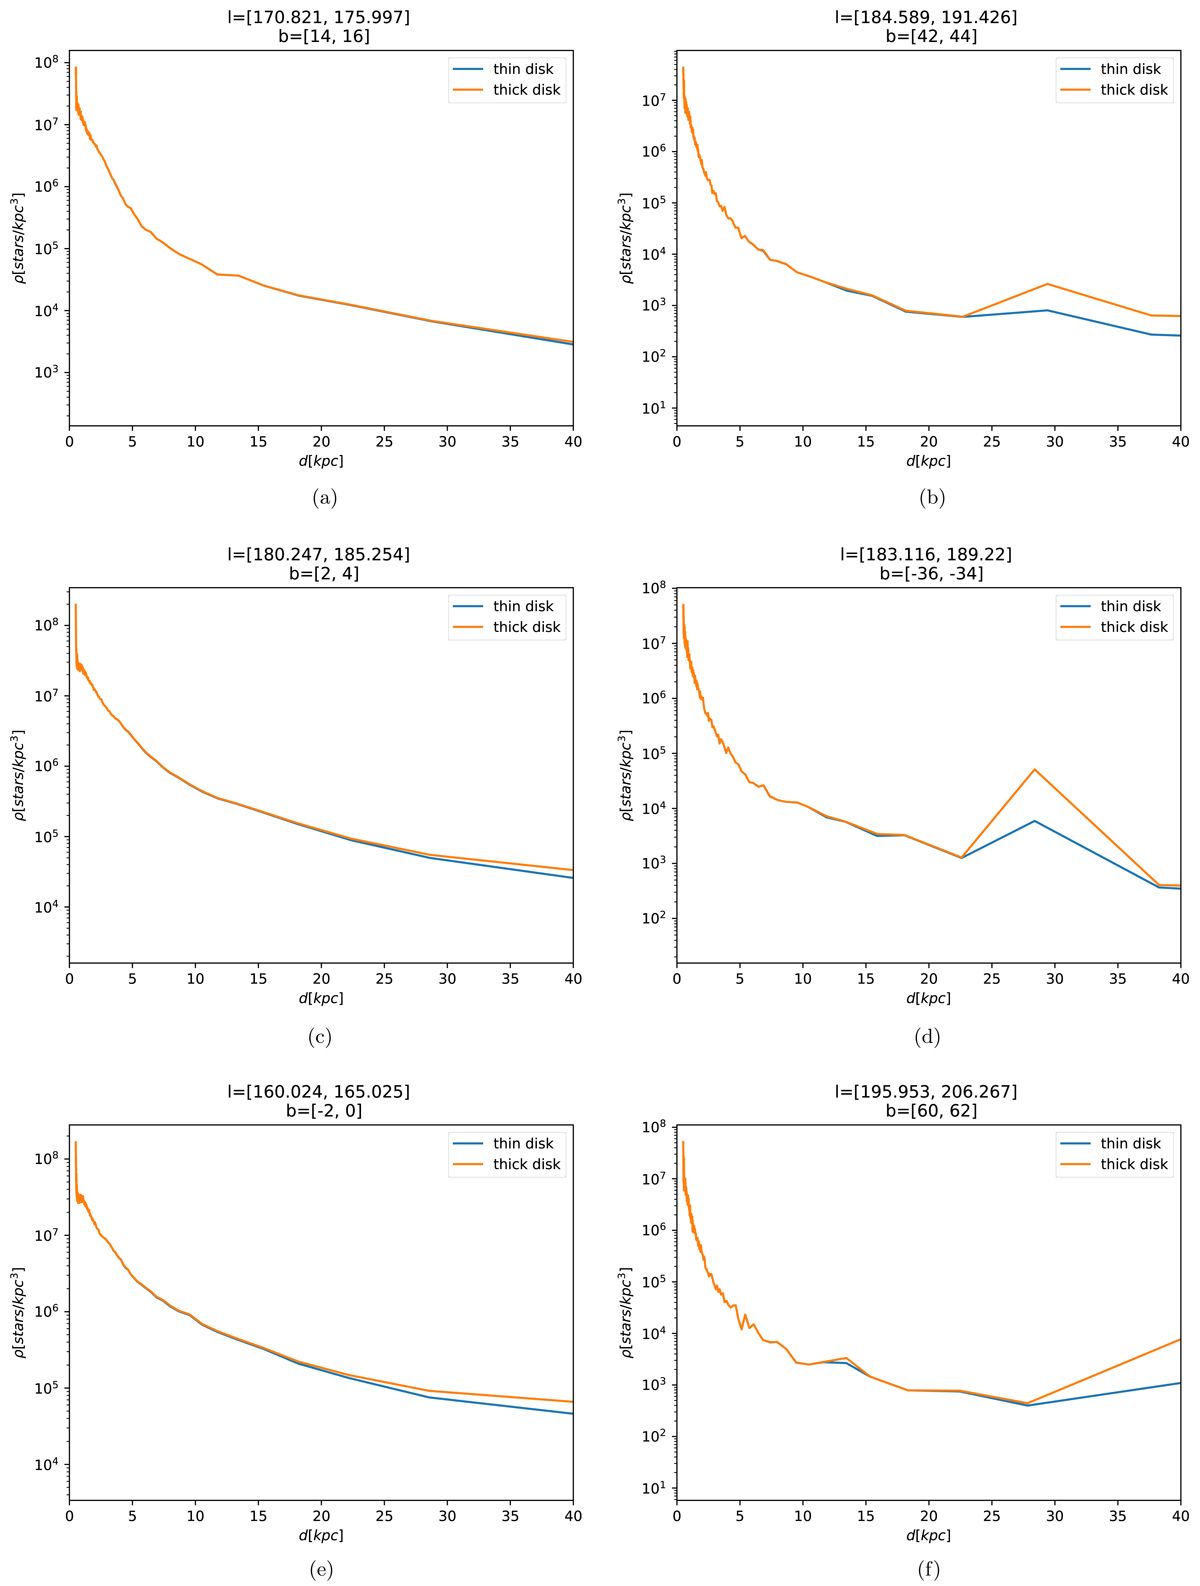
Densities for different lines of sight. Blue curves are densities calculated with the thin-disc luminosity function. Orange curves are densities calculated with the thick-disc luminosity function.
Current usage metrics show cumulative count of Article Views (full-text article views including HTML views, PDF and ePub downloads, according to the available data) and Abstracts Views on Vision4Press platform.
Data correspond to usage on the plateform after 2015. The current usage metrics is available 48-96 hours after online publication and is updated daily on week days.
Initial download of the metrics may take a while.