Fig. 3.
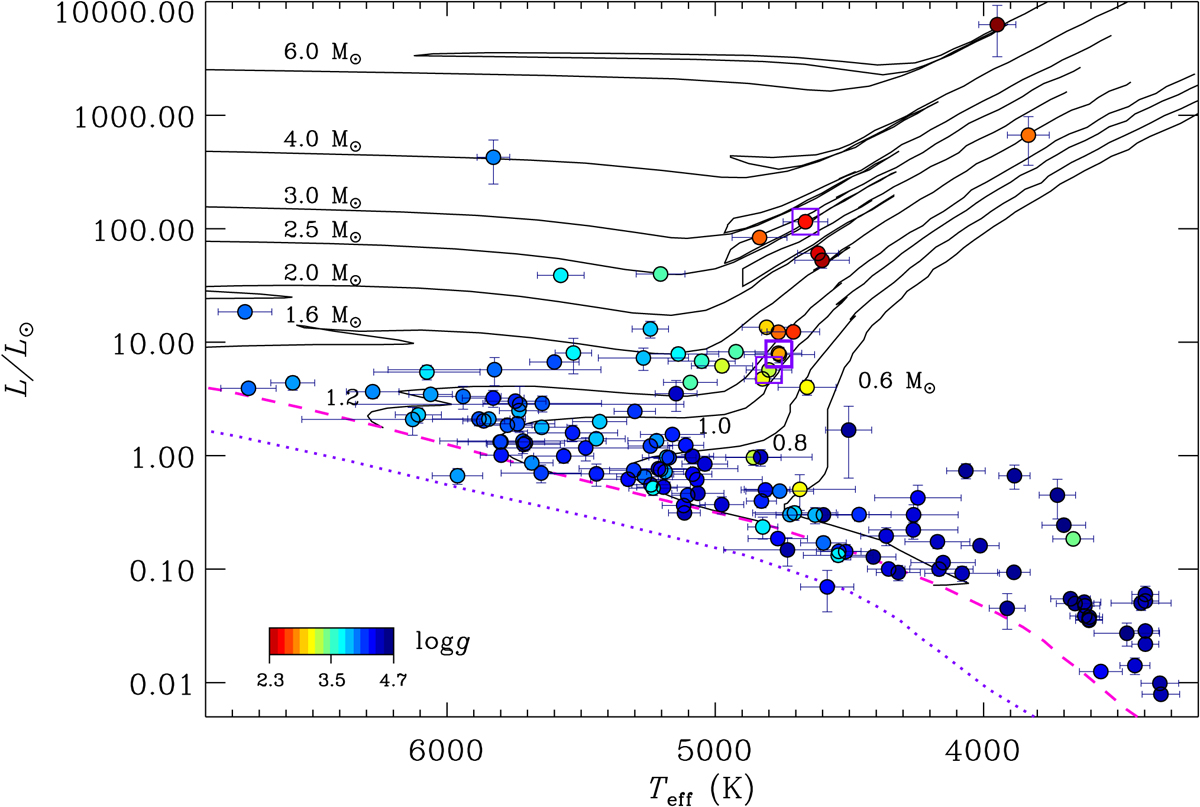
HR diagram of targets with known APs and parallaxes. The symbols are color coded by log g derived from spectra (Sect. 3.2). The four lithium-rich sub-giant or giant stars are enclosed in open squares (Sect. 3.4). The evolutionary tracks from the ZAMS of Girardi et al. (2000) are shown as solid lines with the labels representing their masses. The dashed and dotted lines display the ZAMS with solar metallicity (Z = 0.019) and Z = 0.001 by the same authors, respectively.
Current usage metrics show cumulative count of Article Views (full-text article views including HTML views, PDF and ePub downloads, according to the available data) and Abstracts Views on Vision4Press platform.
Data correspond to usage on the plateform after 2015. The current usage metrics is available 48-96 hours after online publication and is updated daily on week days.
Initial download of the metrics may take a while.