Fig. E.2.
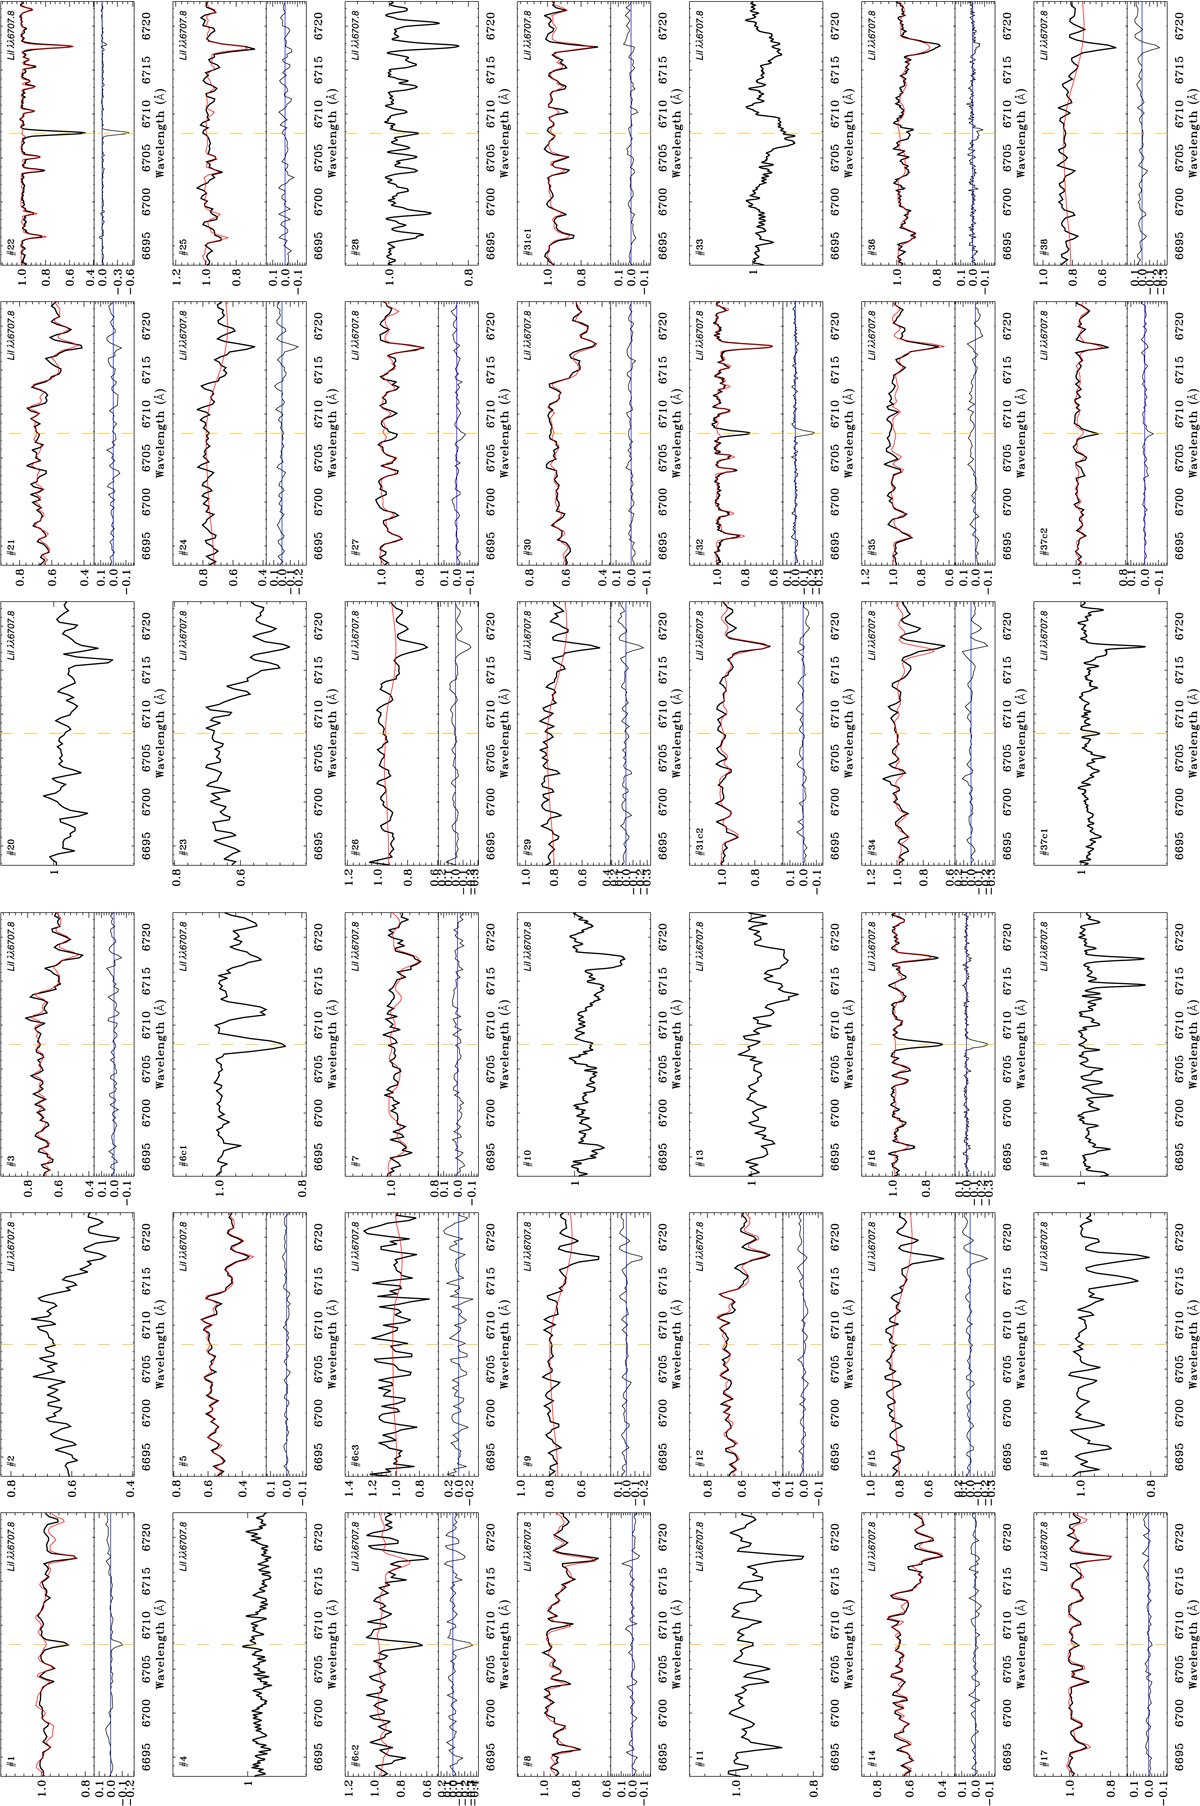
Target spectra (black line) around the lithium line (vertical dashed line). We display the best match rotationally broadened to the v sin i obtained with ROTFIT with the red line only for single stars and SB1 systems (upper panel), while the difference (target–template) spectrum shows their lithium content (lower panel). The number of the source appears in the upper left corner.
Current usage metrics show cumulative count of Article Views (full-text article views including HTML views, PDF and ePub downloads, according to the available data) and Abstracts Views on Vision4Press platform.
Data correspond to usage on the plateform after 2015. The current usage metrics is available 48-96 hours after online publication and is updated daily on week days.
Initial download of the metrics may take a while.