Fig. 1.
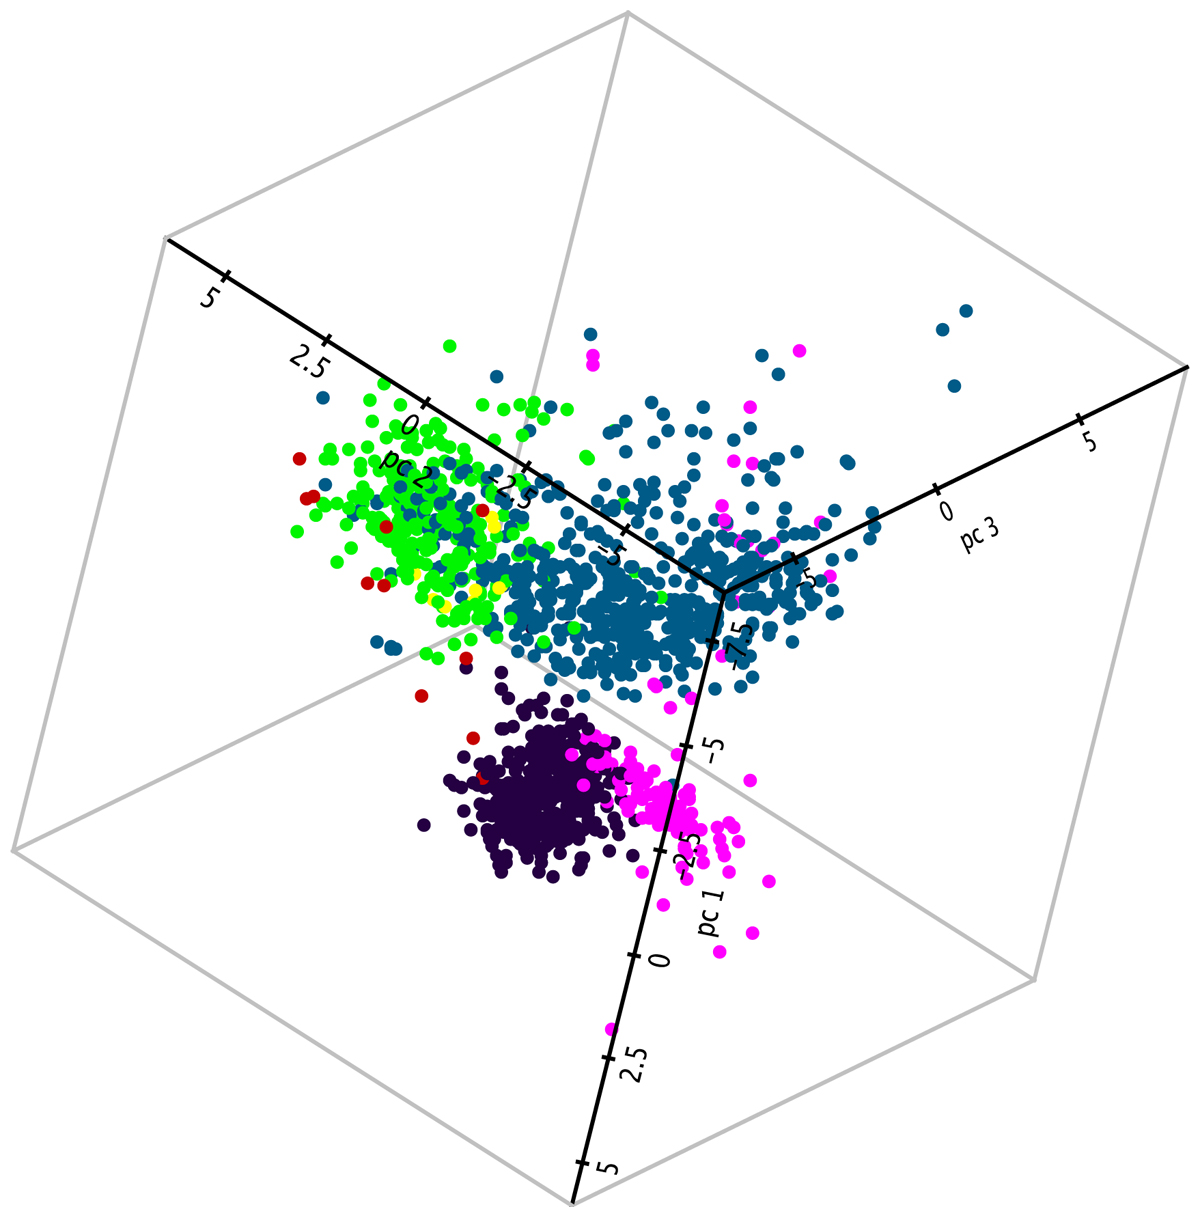
Result of the principal component analysis applied to RASS X-ray sources. The 3D scatter plot displays the three first components, adopting different colors for quasars (green dots), galaxies (blue dots), and stars (other dots). Such a method optimizes the disentangling of various classes of X-ray emitters. The pink dots denote the locus of a priori young stars selected using our learning sample (see text).
Current usage metrics show cumulative count of Article Views (full-text article views including HTML views, PDF and ePub downloads, according to the available data) and Abstracts Views on Vision4Press platform.
Data correspond to usage on the plateform after 2015. The current usage metrics is available 48-96 hours after online publication and is updated daily on week days.
Initial download of the metrics may take a while.