Free Access
Fig. 6
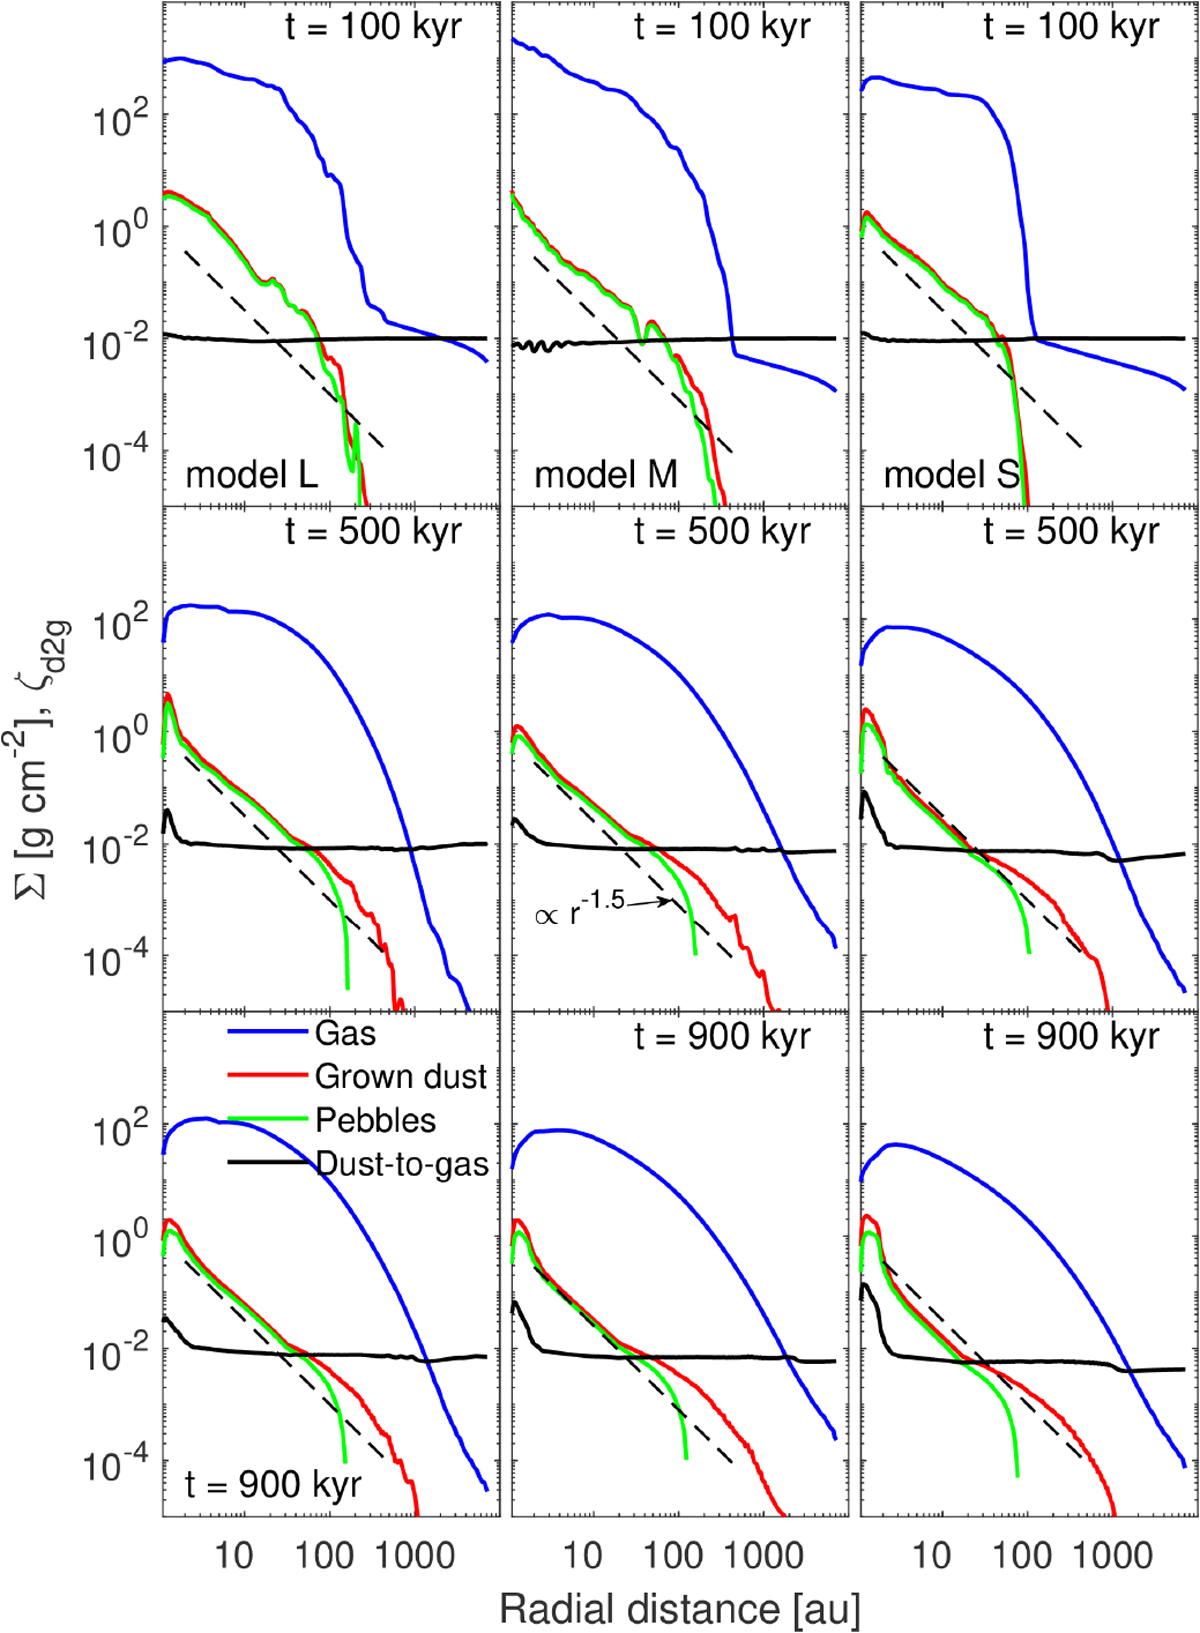
Azimuthally averaged dust-to-gas mass ratio (black), surface density of gas (blue curve), grown dust (red curve), and pebbles (green curve) versus radial distance from the star at distinct evolutionary times for all our models.
Current usage metrics show cumulative count of Article Views (full-text article views including HTML views, PDF and ePub downloads, according to the available data) and Abstracts Views on Vision4Press platform.
Data correspond to usage on the plateform after 2015. The current usage metrics is available 48-96 hours after online publication and is updated daily on week days.
Initial download of the metrics may take a while.