Free Access
Fig. 2
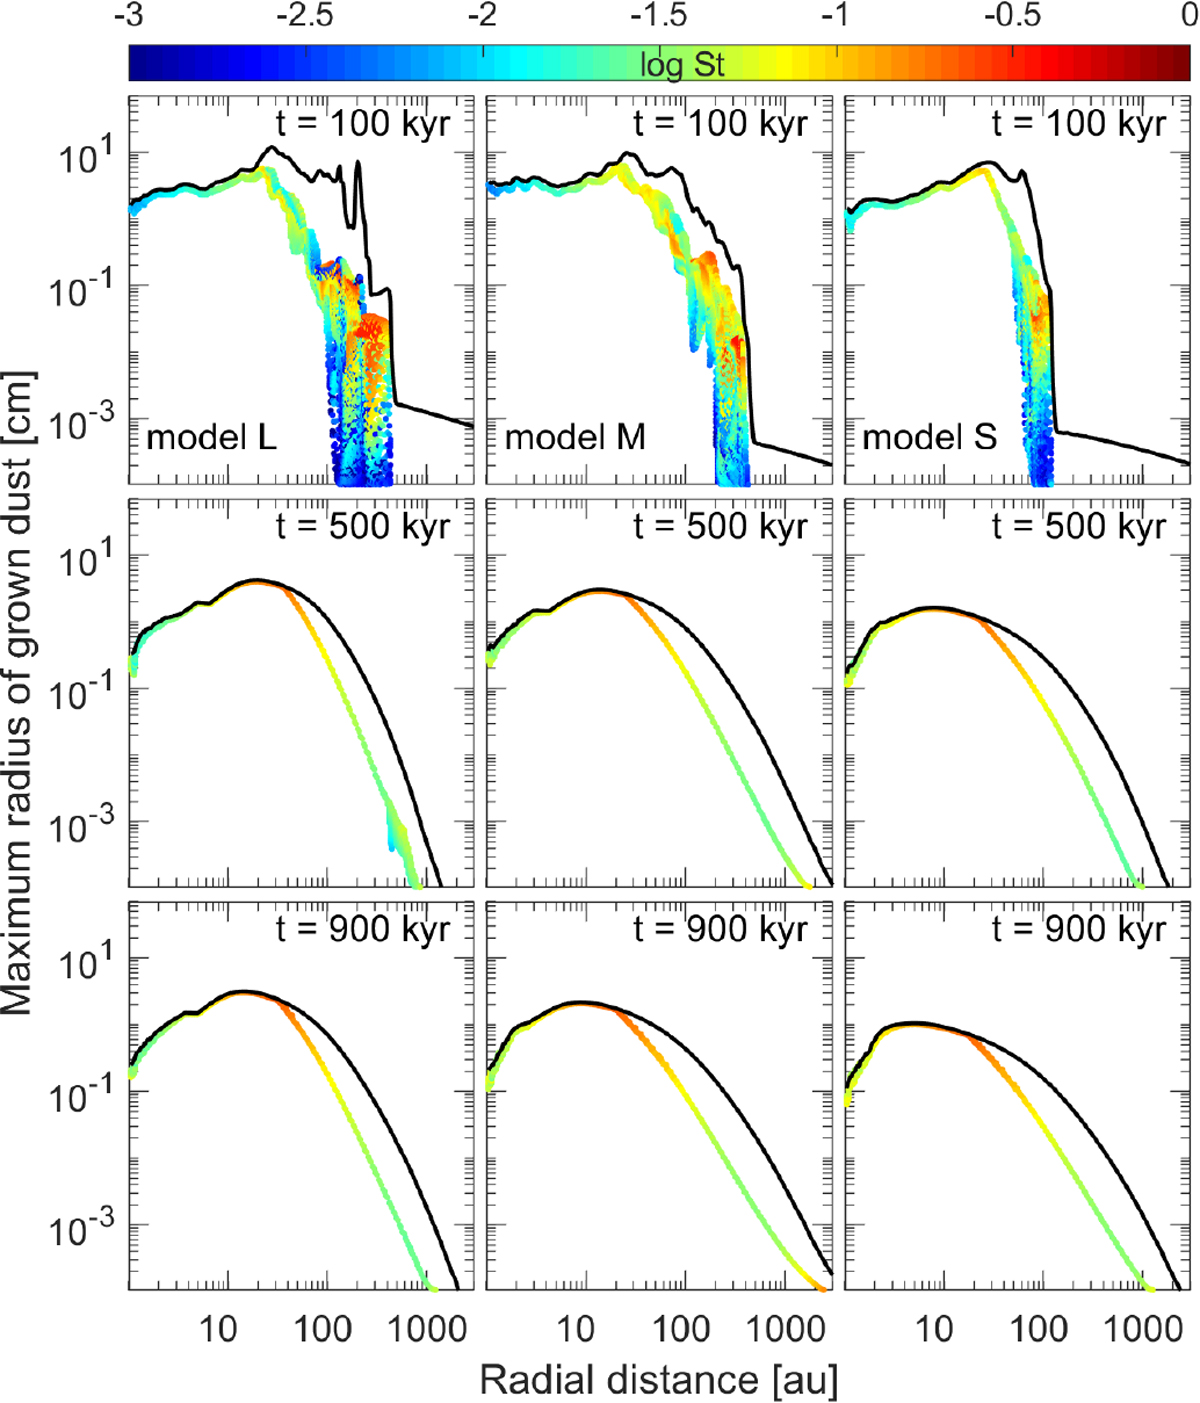
Radial distribution of the maximum radius of grown dust for all azimuthal grid points shown for consecutive times for all models. Color of dots shows the value of Stokes number for each azimuthal grid point. The colorbar is in log scale. Solid black line marks the dust fragmentation size afrag.
Current usage metrics show cumulative count of Article Views (full-text article views including HTML views, PDF and ePub downloads, according to the available data) and Abstracts Views on Vision4Press platform.
Data correspond to usage on the plateform after 2015. The current usage metrics is available 48-96 hours after online publication and is updated daily on week days.
Initial download of the metrics may take a while.