Fig. 6.
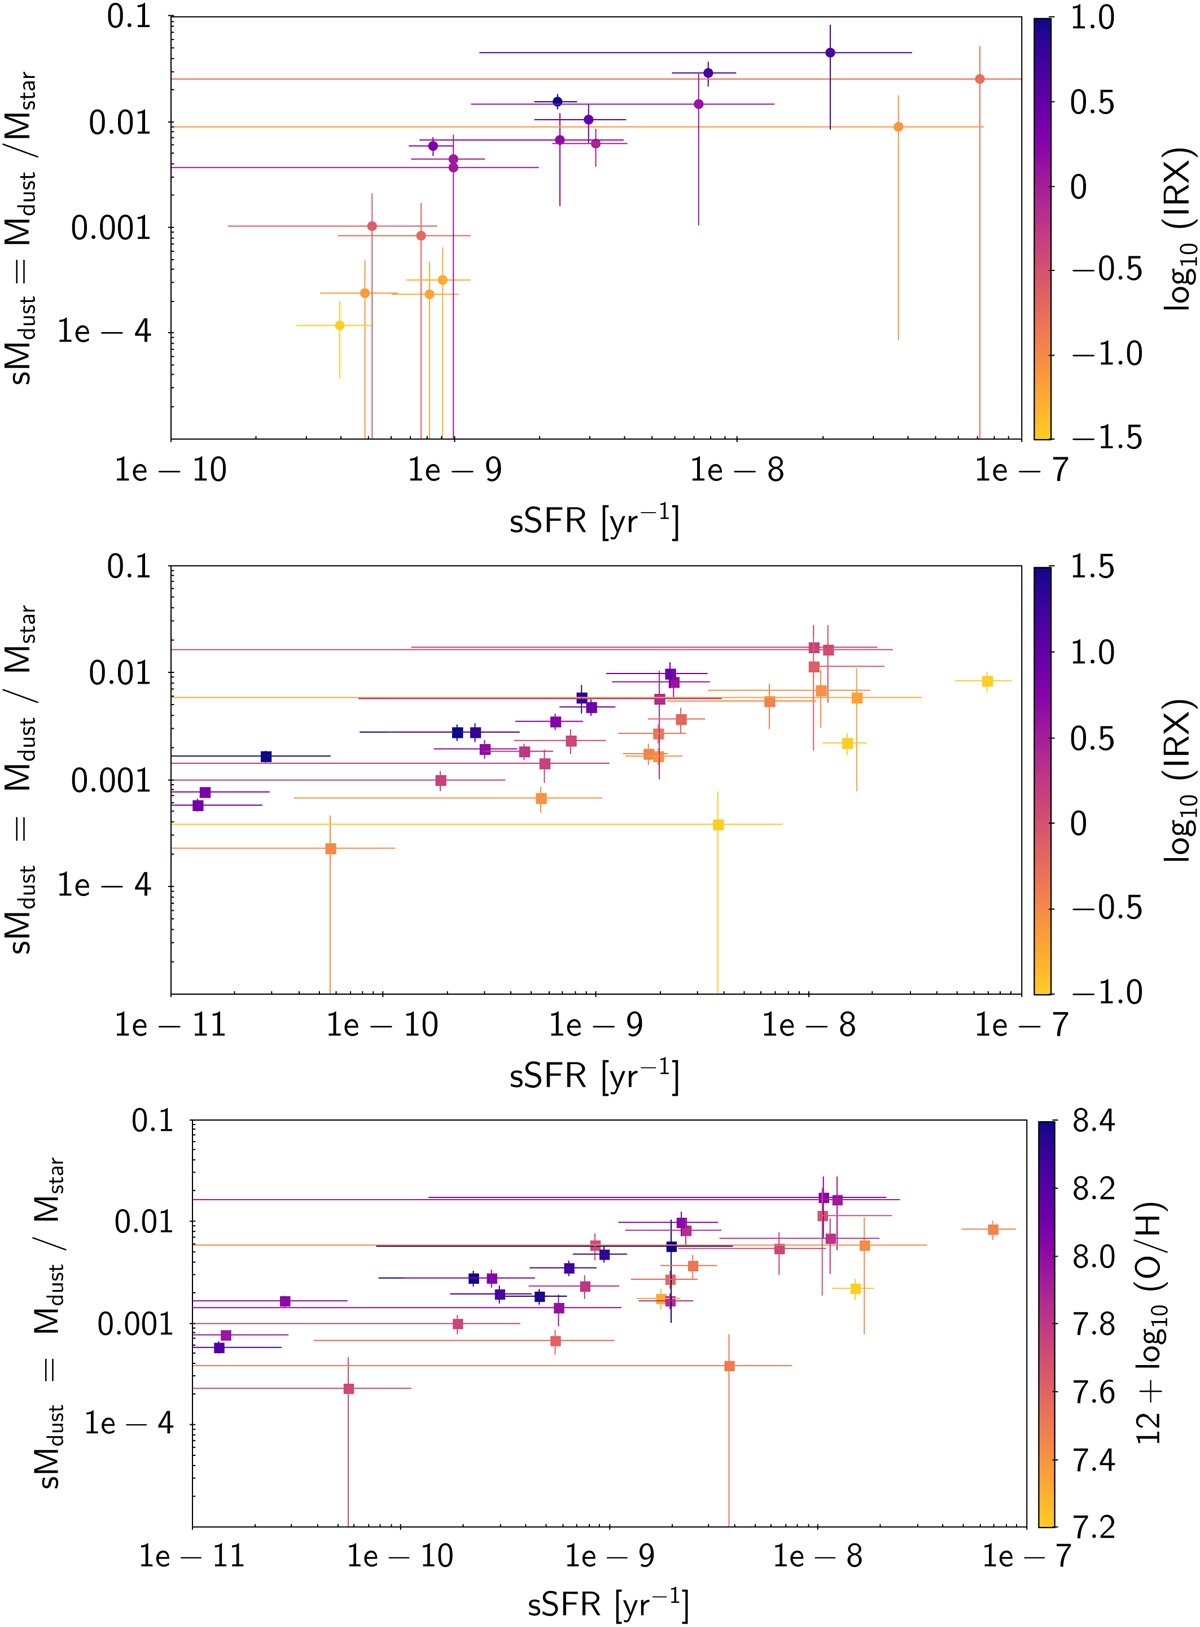
Hi-z LBGs (filled dots, top) and Low-zZ galaxies (filled boxes, middle) dust formation rate diagram, sMdust vs. sSFR, colour-coded in IRX. Like in Fig. 5, colour-coding the data points helps towards interpreting the sequence as an evolutionary sequence with low-IRX objects at high sSFR and again at low sSFR. In the middle range, IRX is higher. Low-zZ galaxies (filled dots, bottom) dust formation rate diagram, sMdust vs. sSFR, colour-coded in metallicity.
Current usage metrics show cumulative count of Article Views (full-text article views including HTML views, PDF and ePub downloads, according to the available data) and Abstracts Views on Vision4Press platform.
Data correspond to usage on the plateform after 2015. The current usage metrics is available 48-96 hours after online publication and is updated daily on week days.
Initial download of the metrics may take a while.