Fig. B.2.
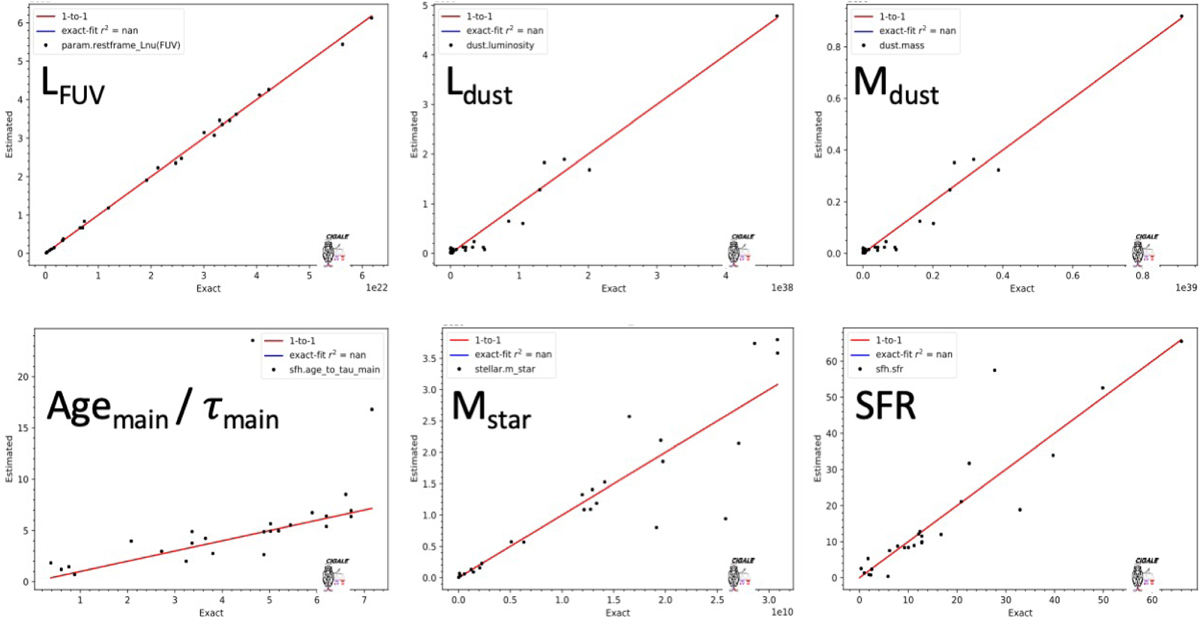
Mock analysis derived from the fit for each of the important parameters for this paper: LFUV, Ldust, Mdust, Agemain, Mstar, and SFR for each representative Hi-z LBG. To build these plots, we use the best-fit modelled SED for each of the Hi-z LBGs. Then, we add the observational noise to the observed data points and we refit the noised best models. Finally, we compare the input and the output parameters. These plots in this figure shows that CIGALE is able to re-derive the input parameters quite nicely and also provide an estimate of the degeneracy between these parameters.
Current usage metrics show cumulative count of Article Views (full-text article views including HTML views, PDF and ePub downloads, according to the available data) and Abstracts Views on Vision4Press platform.
Data correspond to usage on the plateform after 2015. The current usage metrics is available 48-96 hours after online publication and is updated daily on week days.
Initial download of the metrics may take a while.