Fig. 7.
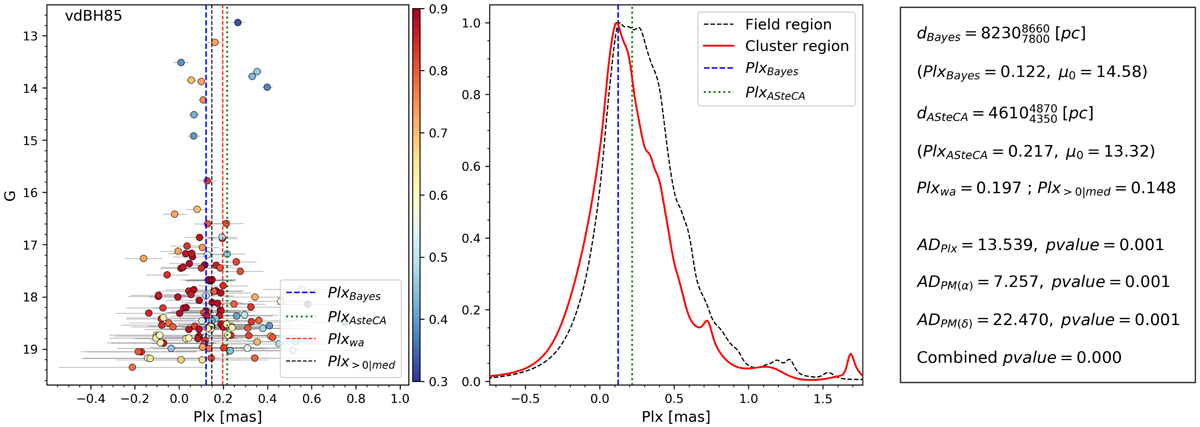
Left panel: distribution of the parallax for all stars with membership probabilities in the cleaned cluster region as a function of the apparent magnitude G (the vertical color scale shows the membership probability of the star) in vdBH 85. Horizontal bars represent the parallax errors as given by Gaia. The different parallax value fittings are shown by dashed lines of different colors: blue shows the Bayesian parallax estimate, green the ASteCA photometric distance, red the weighted average, and black the median (without negative values). Middle panel: normalized comparison between the parallax distributions inside (red line) and outside the cluster region (dashed black line). The frame at the right summarizes the distances in parsecs according to the Bayesian analysis (dBayes) and ASteCA (dASteCA), followed by the corresponding parallax value, Plx, and corrected distance modulus (μ0). Both fittings are indicated by the vertical blue and green dashed lines. The last four text lines in the right panel list the AD values for Plx, PM(α), and PM(δ), followed by the corresponding p-values, and finally, the combined p-value.
Current usage metrics show cumulative count of Article Views (full-text article views including HTML views, PDF and ePub downloads, according to the available data) and Abstracts Views on Vision4Press platform.
Data correspond to usage on the plateform after 2015. The current usage metrics is available 48-96 hours after online publication and is updated daily on week days.
Initial download of the metrics may take a while.