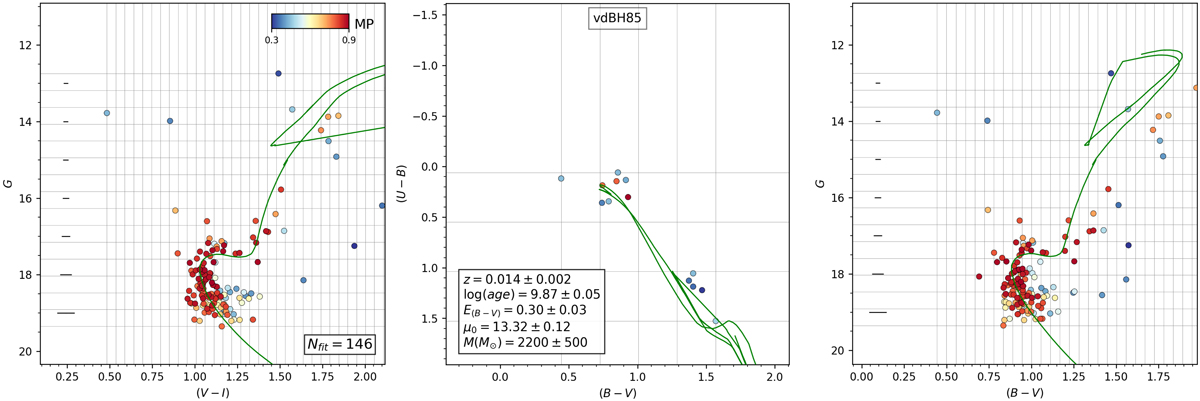
Fig. 6.

From left to right: G vs. (V − I), (B − V) vs. (U − B), and G vs. (B − V) clean diagrams after field interlopers were removed by ASteCA over vdBH 85. The color of each star reflects its membership probability (MP). Corresponding values are in the color bar at the upper right corner in the G vs. (V − I) diagram (left) labeled MP. The CCD in the middle always shows fewer stars because of the U filter. The grid lines trace the edges of the three-dimensional photometric histograms we used to evaluate the likelihood function described in Sect. 4.2. The inset in the lower right corner in the G vs. (V − I) diagram shows the number of stars used by ASteCA to compare with synthetic clusters. The inset in the middle panel includes the final results for metallicity, log(age), E(B − V), the corrected distance modulus, and the total cluster mass provided by ASteCA. The green continuous line in the three diagrams is a reference isochrone. In particular, the green line in the CCD, middle panel, shows the most probable E(B − V) value fitting found by ASteCA.
Current usage metrics show cumulative count of Article Views (full-text article views including HTML views, PDF and ePub downloads, according to the available data) and Abstracts Views on Vision4Press platform.
Data correspond to usage on the plateform after 2015. The current usage metrics is available 48-96 hours after online publication and is updated daily on week days.
Initial download of the metrics may take a while.


