Fig. 5.
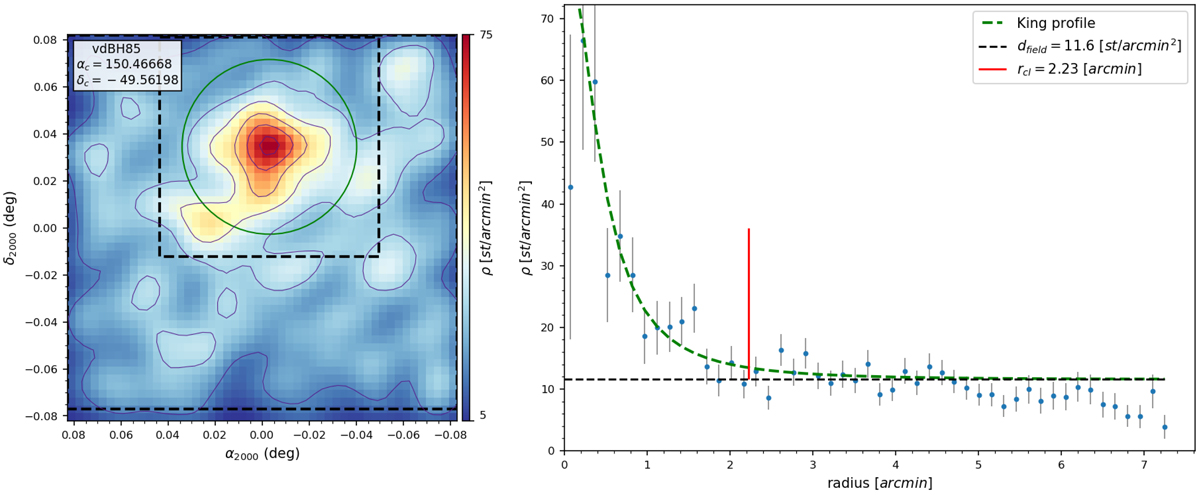
From left to right, we present in the first panel a contour plot showing the position of the overdensity associated with vdBH 85. The green inner circle shows the cluster size, and the two black dashed-line squares enclose the region that ASteCA used to estimate the field stellar properties. The lower density values at the frame borders are an artifact of the kernel density estimate method that we employed to generate the density maps. Equatorial coordinates in decimal format are indicated. The color bar denotes the star number per square arcminute (linear scale). These values are slightly different from those in the panel to the right because they are obtained with a different method (nearest neighbors). The second panel shows the RDP as blue dots with standard deviations as vertical black lines. The King profile is shown as a dashed green line. The horizontal black line is the mean field stellar density. The vertical red line is the adopted cluster radius.
Current usage metrics show cumulative count of Article Views (full-text article views including HTML views, PDF and ePub downloads, according to the available data) and Abstracts Views on Vision4Press platform.
Data correspond to usage on the plateform after 2015. The current usage metrics is available 48-96 hours after online publication and is updated daily on week days.
Initial download of the metrics may take a while.