Fig. 4.
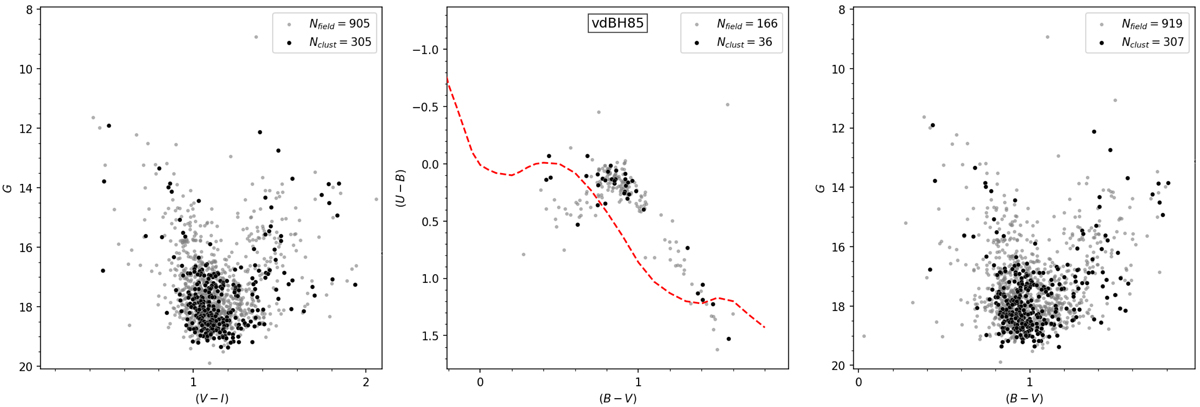
From left to right: G vs. (V − I), (B − V) vs. (U − B), and V vs. (B − V) diagrams for all the stars observed in the region of van den Bergh-Hagen 85. The red dashed line in the CCD shows the position of the ZAMS (Aller et al. 1982). Insets in each diagram contain the number of stars in the cluster region (Nclust, black circles) and in the surrounding field (Nfield, gray circles).
Current usage metrics show cumulative count of Article Views (full-text article views including HTML views, PDF and ePub downloads, according to the available data) and Abstracts Views on Vision4Press platform.
Data correspond to usage on the plateform after 2015. The current usage metrics is available 48-96 hours after online publication and is updated daily on week days.
Initial download of the metrics may take a while.