Free Access
Fig. 3.
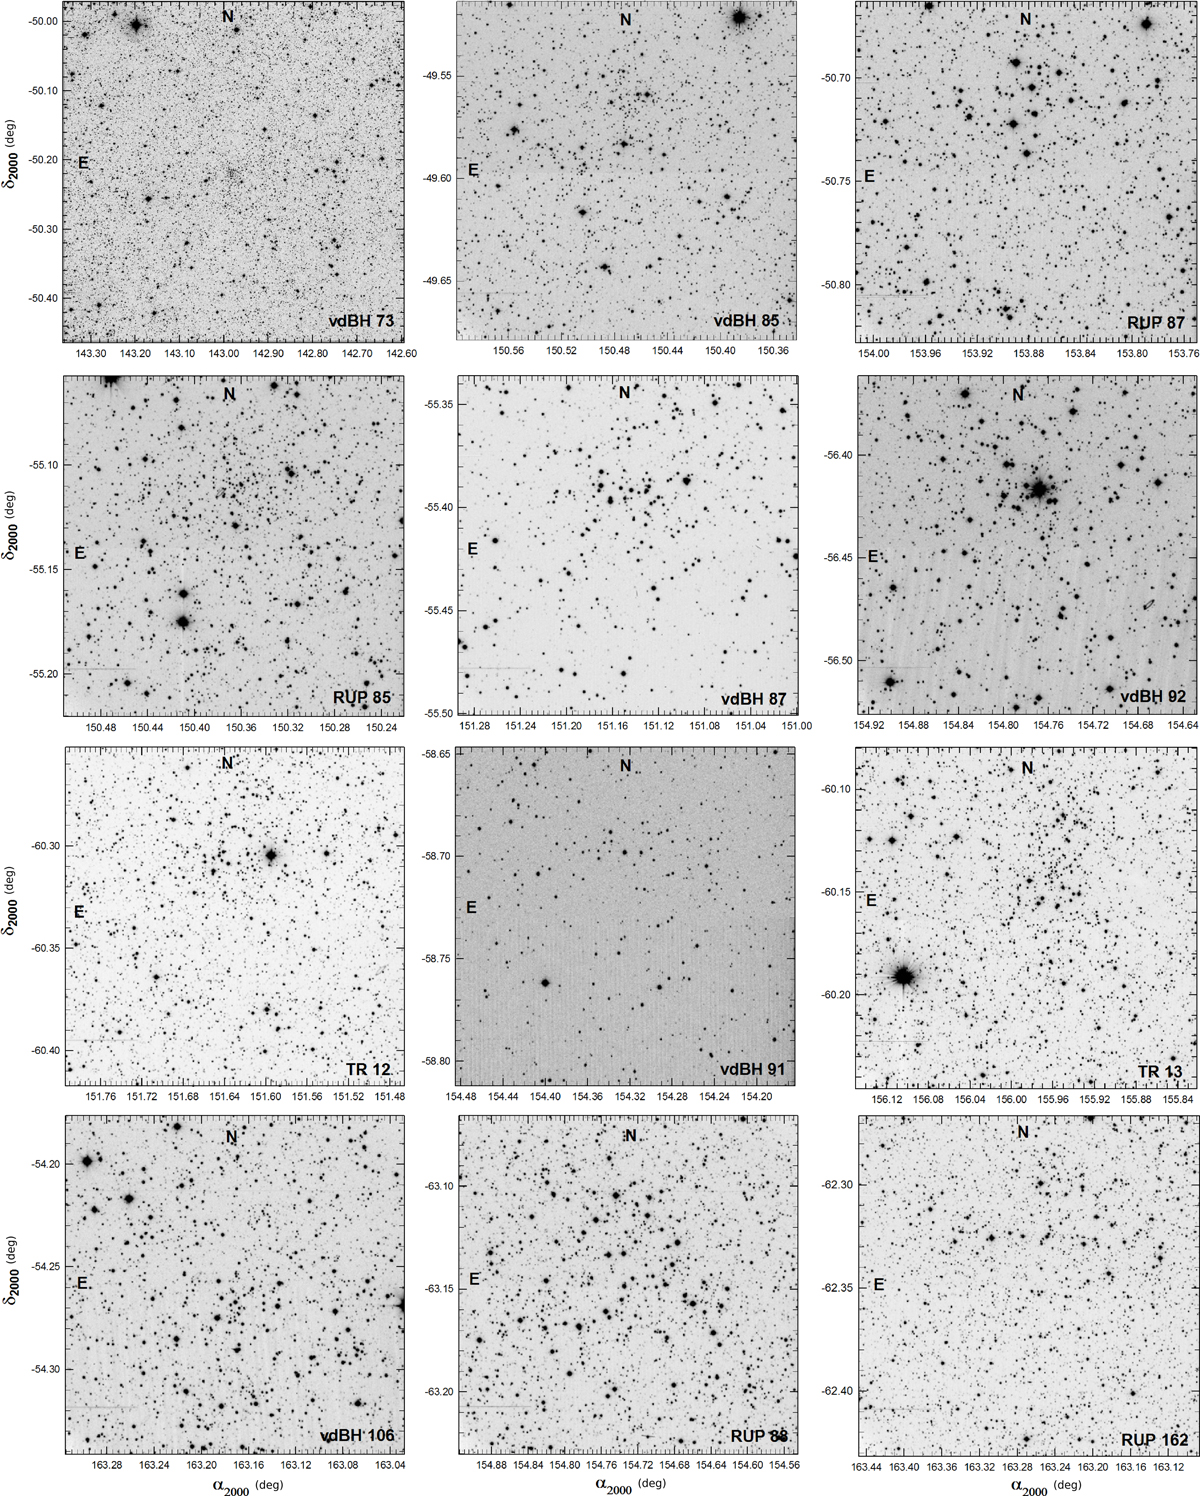
V images (charts) of the observed clusters (names inserted) ordered from top to bottom and from left to right by increasing longitude. Decimal α and δ coordinates for the 2000 equinox are indicated. North and east are also shown.
Current usage metrics show cumulative count of Article Views (full-text article views including HTML views, PDF and ePub downloads, according to the available data) and Abstracts Views on Vision4Press platform.
Data correspond to usage on the plateform after 2015. The current usage metrics is available 48-96 hours after online publication and is updated daily on week days.
Initial download of the metrics may take a while.