Fig. 17.
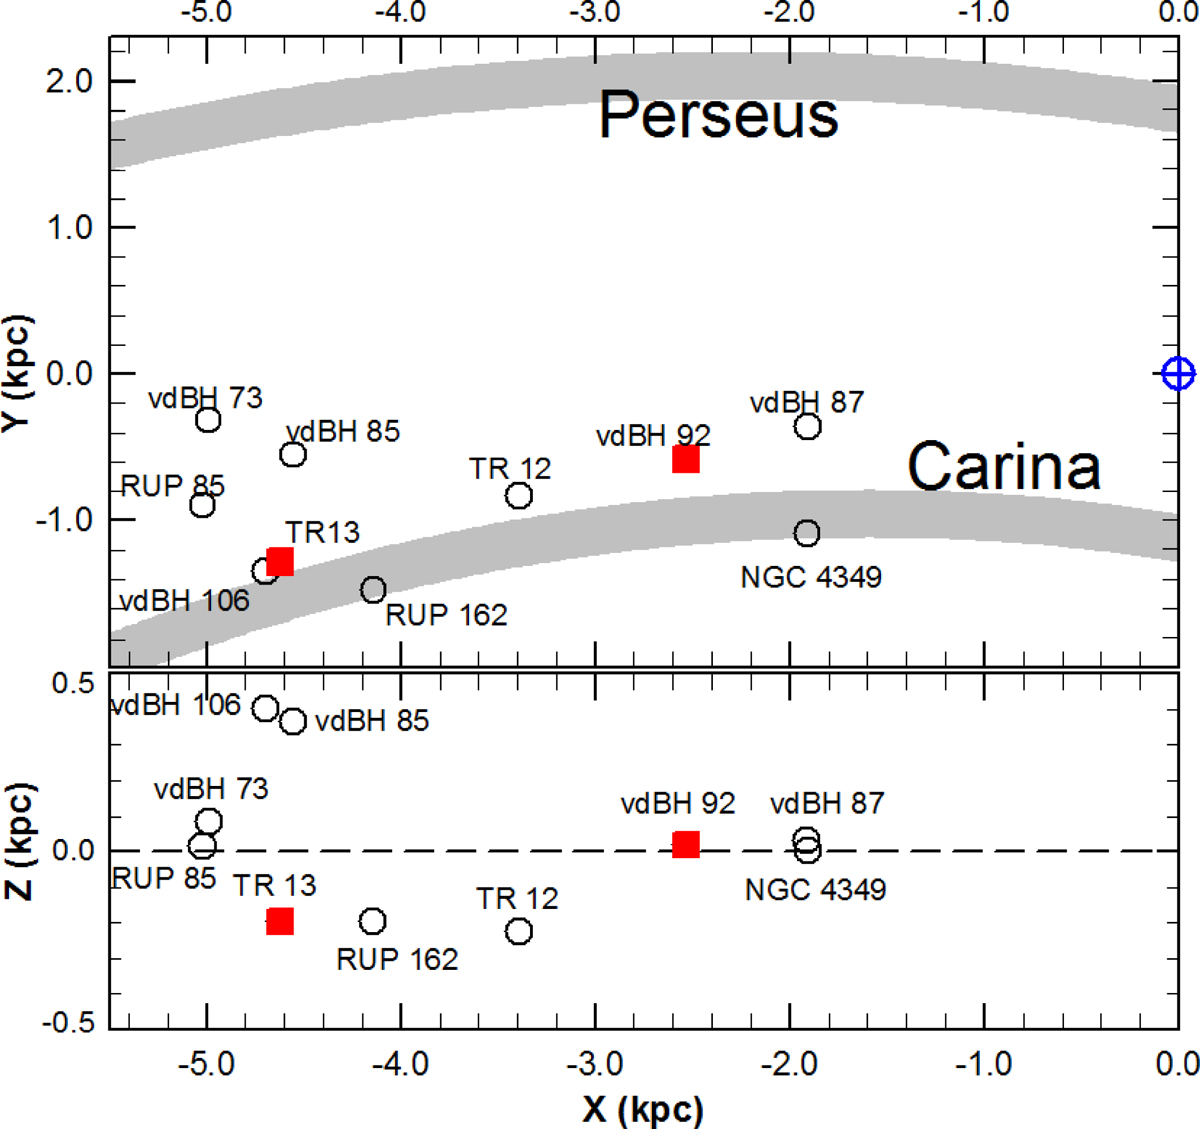
X − Y (upper panel) and X − Z (lower plane) projection of the true and probable clusters in our sample (open circles). The red squares enclose the youngest clusters in our list (see Table 4). The thick gray lines in the upper panel show the trace of the Perseus and Carina arms according to Vallée (2005). The position of the Sun is shown by a blue crossed circle. The dashed line in the lower panel depicts the Galactic equator.
Current usage metrics show cumulative count of Article Views (full-text article views including HTML views, PDF and ePub downloads, according to the available data) and Abstracts Views on Vision4Press platform.
Data correspond to usage on the plateform after 2015. The current usage metrics is available 48-96 hours after online publication and is updated daily on week days.
Initial download of the metrics may take a while.