Fig. 16.
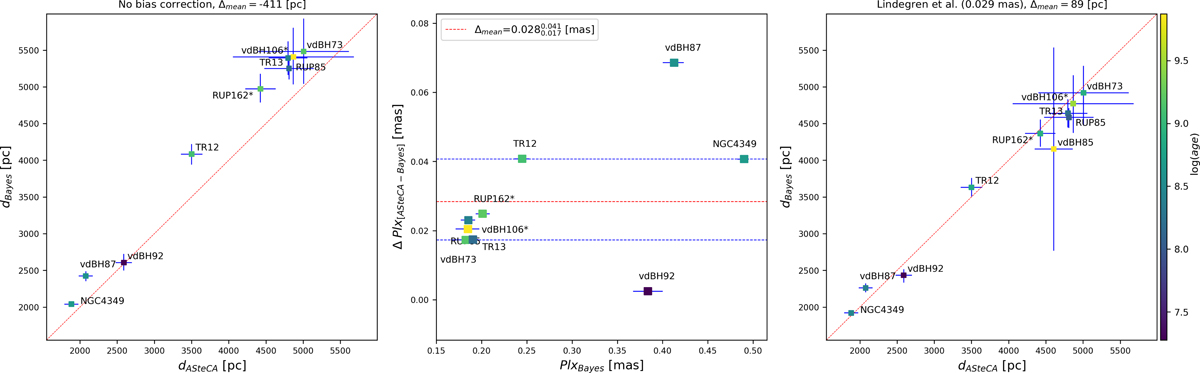
Left: ASteCA (photometric) vs. Bayesian (parallax) distances for the clusters listed in Table 4 that are confirmed to be real clusters. No bias correction was applied to the parallax data. The color bar at the right indicates log(age) values. Center: offset (ASteCA – Bayes) for distances expressed as parallax in miliarcseconds. Right: same as left plot, with bias corrections from Lindegren et al. (+0.029 mas). The cluster vdBH85 is included here; its distance value is estimated from the list of individual distances reported by Bailer-Jones et al. (2018).
Current usage metrics show cumulative count of Article Views (full-text article views including HTML views, PDF and ePub downloads, according to the available data) and Abstracts Views on Vision4Press platform.
Data correspond to usage on the plateform after 2015. The current usage metrics is available 48-96 hours after online publication and is updated daily on week days.
Initial download of the metrics may take a while.