Fig. 9.
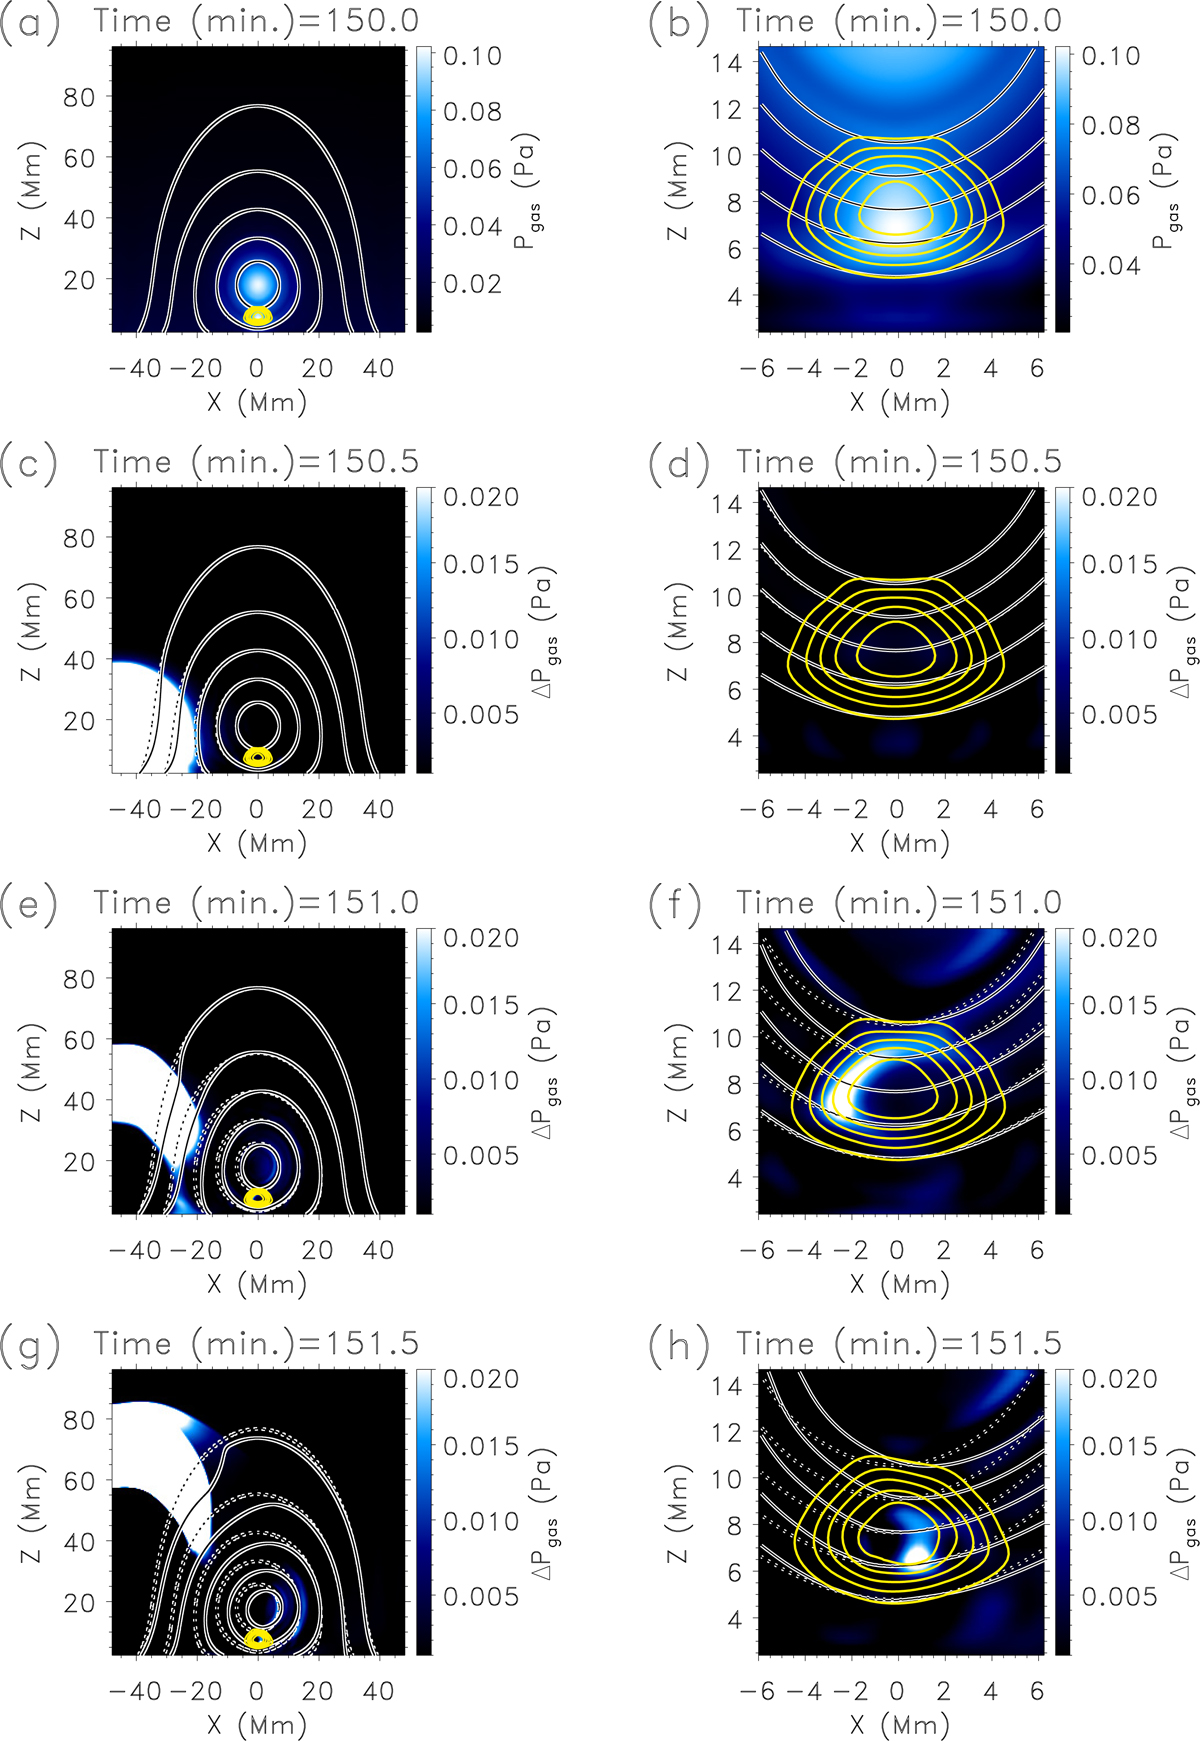
Evolution of the magnetic field and gas pressure during the wavefront propagation. Panels a, b: initial gas pressure distribution; panels c–h: running difference of the two consecutive snapshots. Left-hand panels: same as the right-hand panels but focused at the location around the prominence. The dashed lines indicate the magnetic field lines before the perturbation. The yellow lines represent the density isocontours.
Current usage metrics show cumulative count of Article Views (full-text article views including HTML views, PDF and ePub downloads, according to the available data) and Abstracts Views on Vision4Press platform.
Data correspond to usage on the plateform after 2015. The current usage metrics is available 48-96 hours after online publication and is updated daily on week days.
Initial download of the metrics may take a while.