Free Access
Fig. 8.
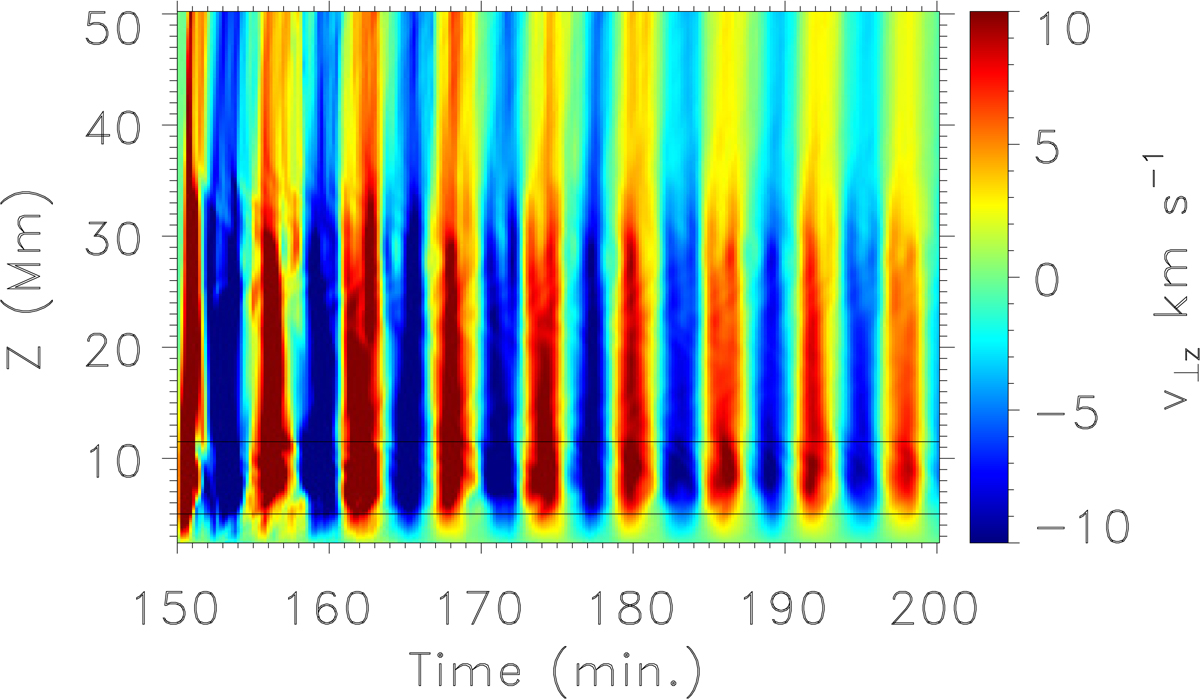
Time-distance diagram of the vertical component of the transverse velocity along z-axis at x = 0, in the model with the shear angle of θ = 45° and the density contrast of χ = 200. Black lines denote a region where the prominence mass is located.
Current usage metrics show cumulative count of Article Views (full-text article views including HTML views, PDF and ePub downloads, according to the available data) and Abstracts Views on Vision4Press platform.
Data correspond to usage on the plateform after 2015. The current usage metrics is available 48-96 hours after online publication and is updated daily on week days.
Initial download of the metrics may take a while.