Fig. 7.
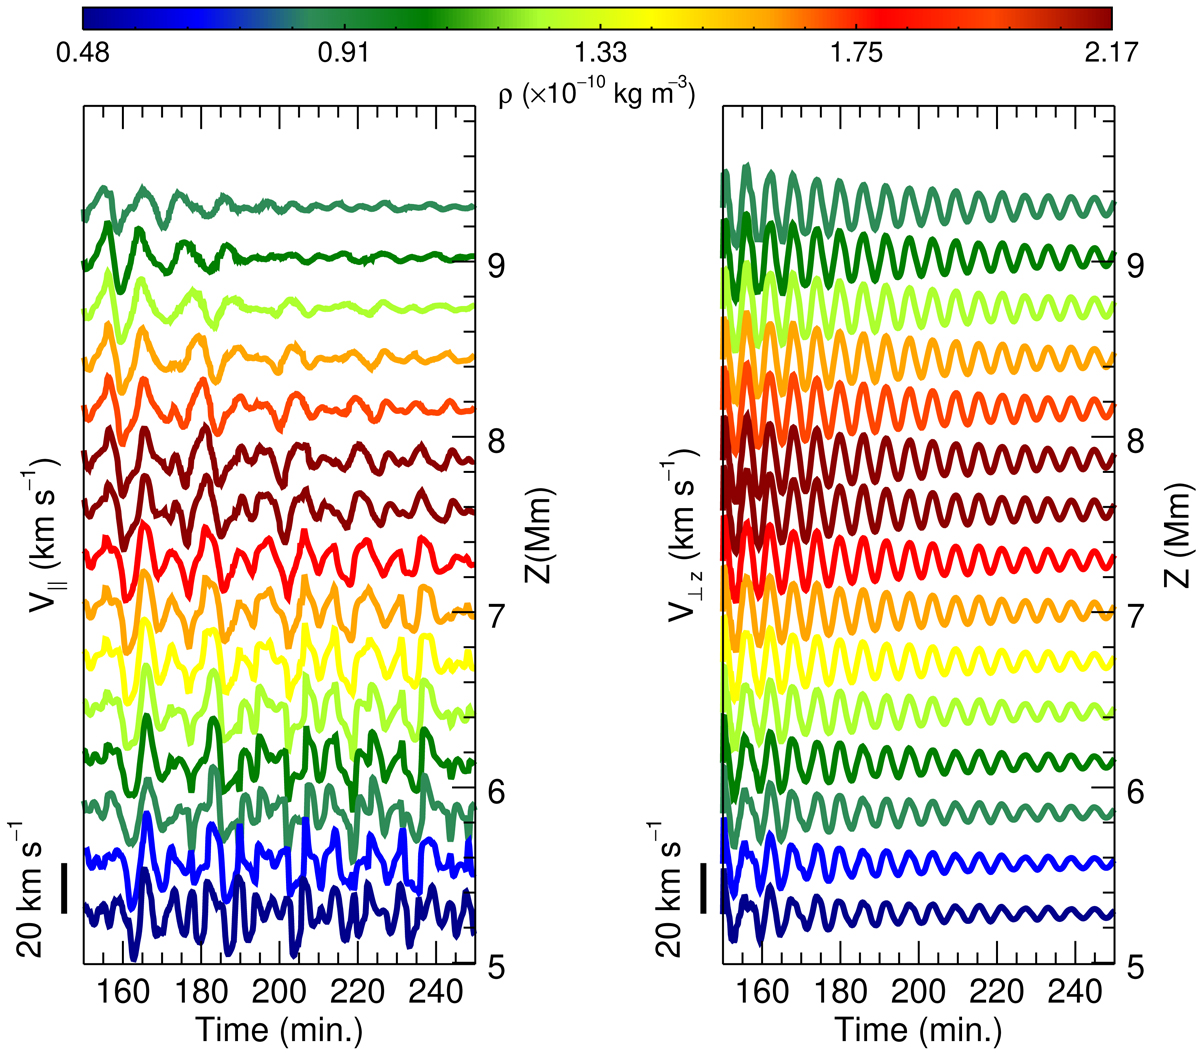
Temporal evolution of the longitudinal velocity (left panel) and vertical component of the transverse velocity (right panel) after the vertical perturbation. The prominence model used has a shear angle of θ = 45° and a density contrast of χ = 200. The colored lines indicate velocity variations at the center of mass (right) or the certain distance from the center of mass (left) at each field line. The colors indicate the maximum initial density at the field line according to the color bar scale. The right vertical axis indicates the height of the magnetic dips; the left vertical axis represents the scale of the maximum initial amplitude.
Current usage metrics show cumulative count of Article Views (full-text article views including HTML views, PDF and ePub downloads, according to the available data) and Abstracts Views on Vision4Press platform.
Data correspond to usage on the plateform after 2015. The current usage metrics is available 48-96 hours after online publication and is updated daily on week days.
Initial download of the metrics may take a while.