Fig. 4
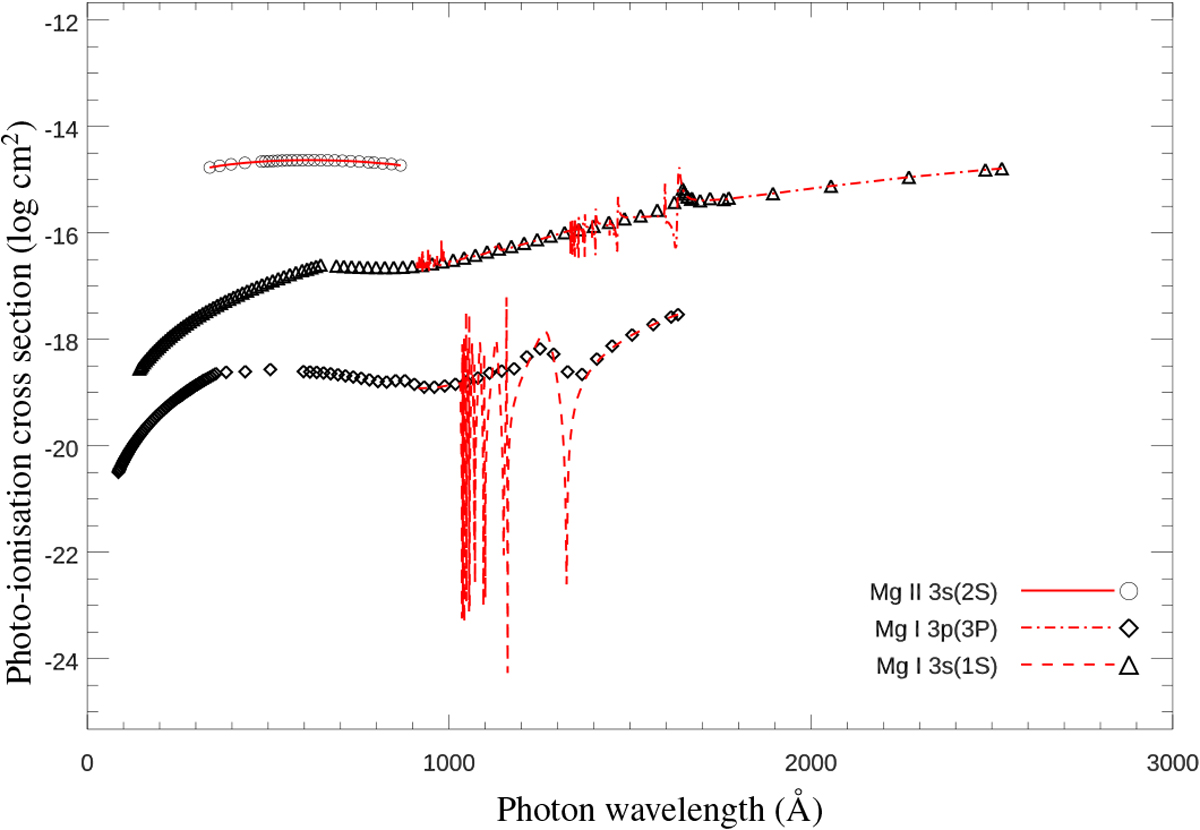
Photo-ionisation cross-section data used in the MULTI (red lines) and TLUSTY (black symbols) calculations for two b-f transitions of Mg I and the one from the ground level of Mg II. The red lines are the values taken from the TOPBASE database without the cross sections below 911 Å (except for the Mg II b-f transition). The symbols are the resonance-averaged photo-ionisation cross sections of the TOPBASE data (see Allende Prieto et al. 2003). The b-f cross section of the Mg II 3s(2S) and the Mg I 3p(3P) levels are vertically shifted by 4 and 2 log units, respectively, for visualisation.
Current usage metrics show cumulative count of Article Views (full-text article views including HTML views, PDF and ePub downloads, according to the available data) and Abstracts Views on Vision4Press platform.
Data correspond to usage on the plateform after 2015. The current usage metrics is available 48-96 hours after online publication and is updated daily on week days.
Initial download of the metrics may take a while.