Fig. 13
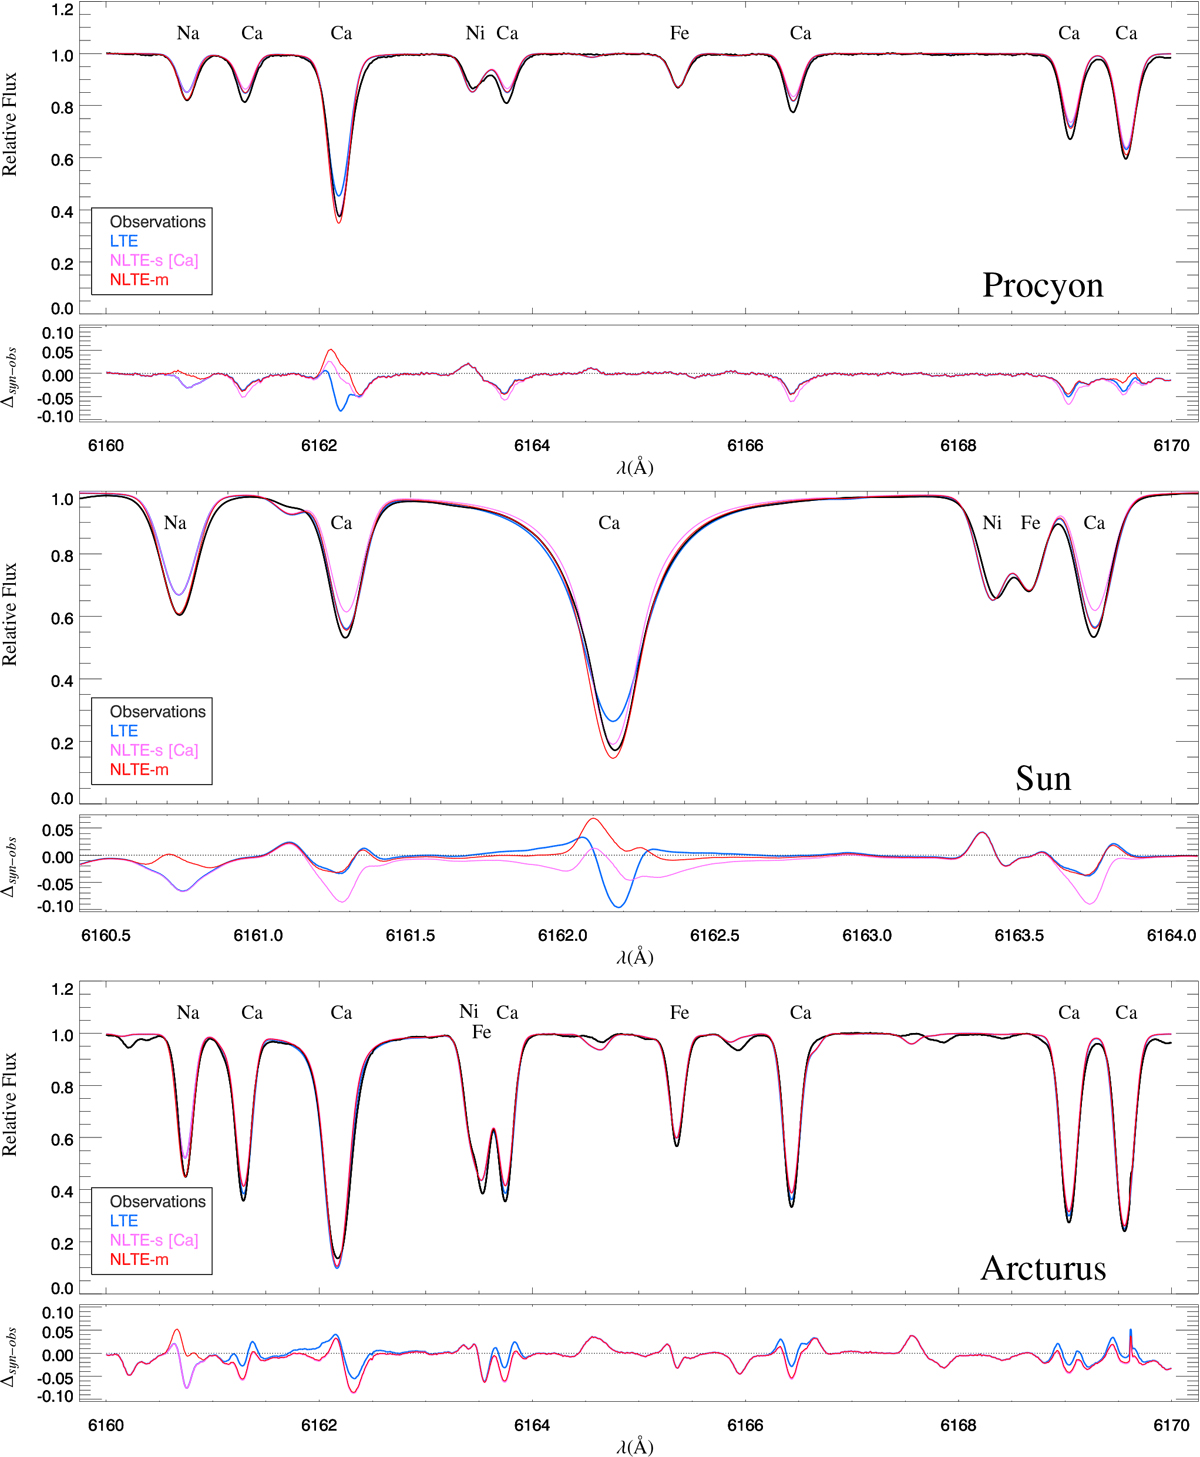
Comparison between synthetic spectra and observations of the section around 6162 Å for Procyon (top), the Sun (middle), and Arcturus (bottom), where several Ca lines can be observed. The black lines represent the observations; and blue, pink, and red are the synthetic spectra in LTE, NLTE-s[Ca], and NLTE-m, respectively. Bellow each spectrum we plot the residuals (synthetic-observed). The Ca Abundance and Vmac adoptedfor the LTE, NLTE-s [Ca], and NLTE-m synthetic spectra are [A(Ca), Vmac (Km s−1)] = [6.10, 5.1] for Procyon, [6.30, 1.0] for the Sun, and [5.99, 3.6] for Arcturus.
Current usage metrics show cumulative count of Article Views (full-text article views including HTML views, PDF and ePub downloads, according to the available data) and Abstracts Views on Vision4Press platform.
Data correspond to usage on the plateform after 2015. The current usage metrics is available 48-96 hours after online publication and is updated daily on week days.
Initial download of the metrics may take a while.