Fig. 9
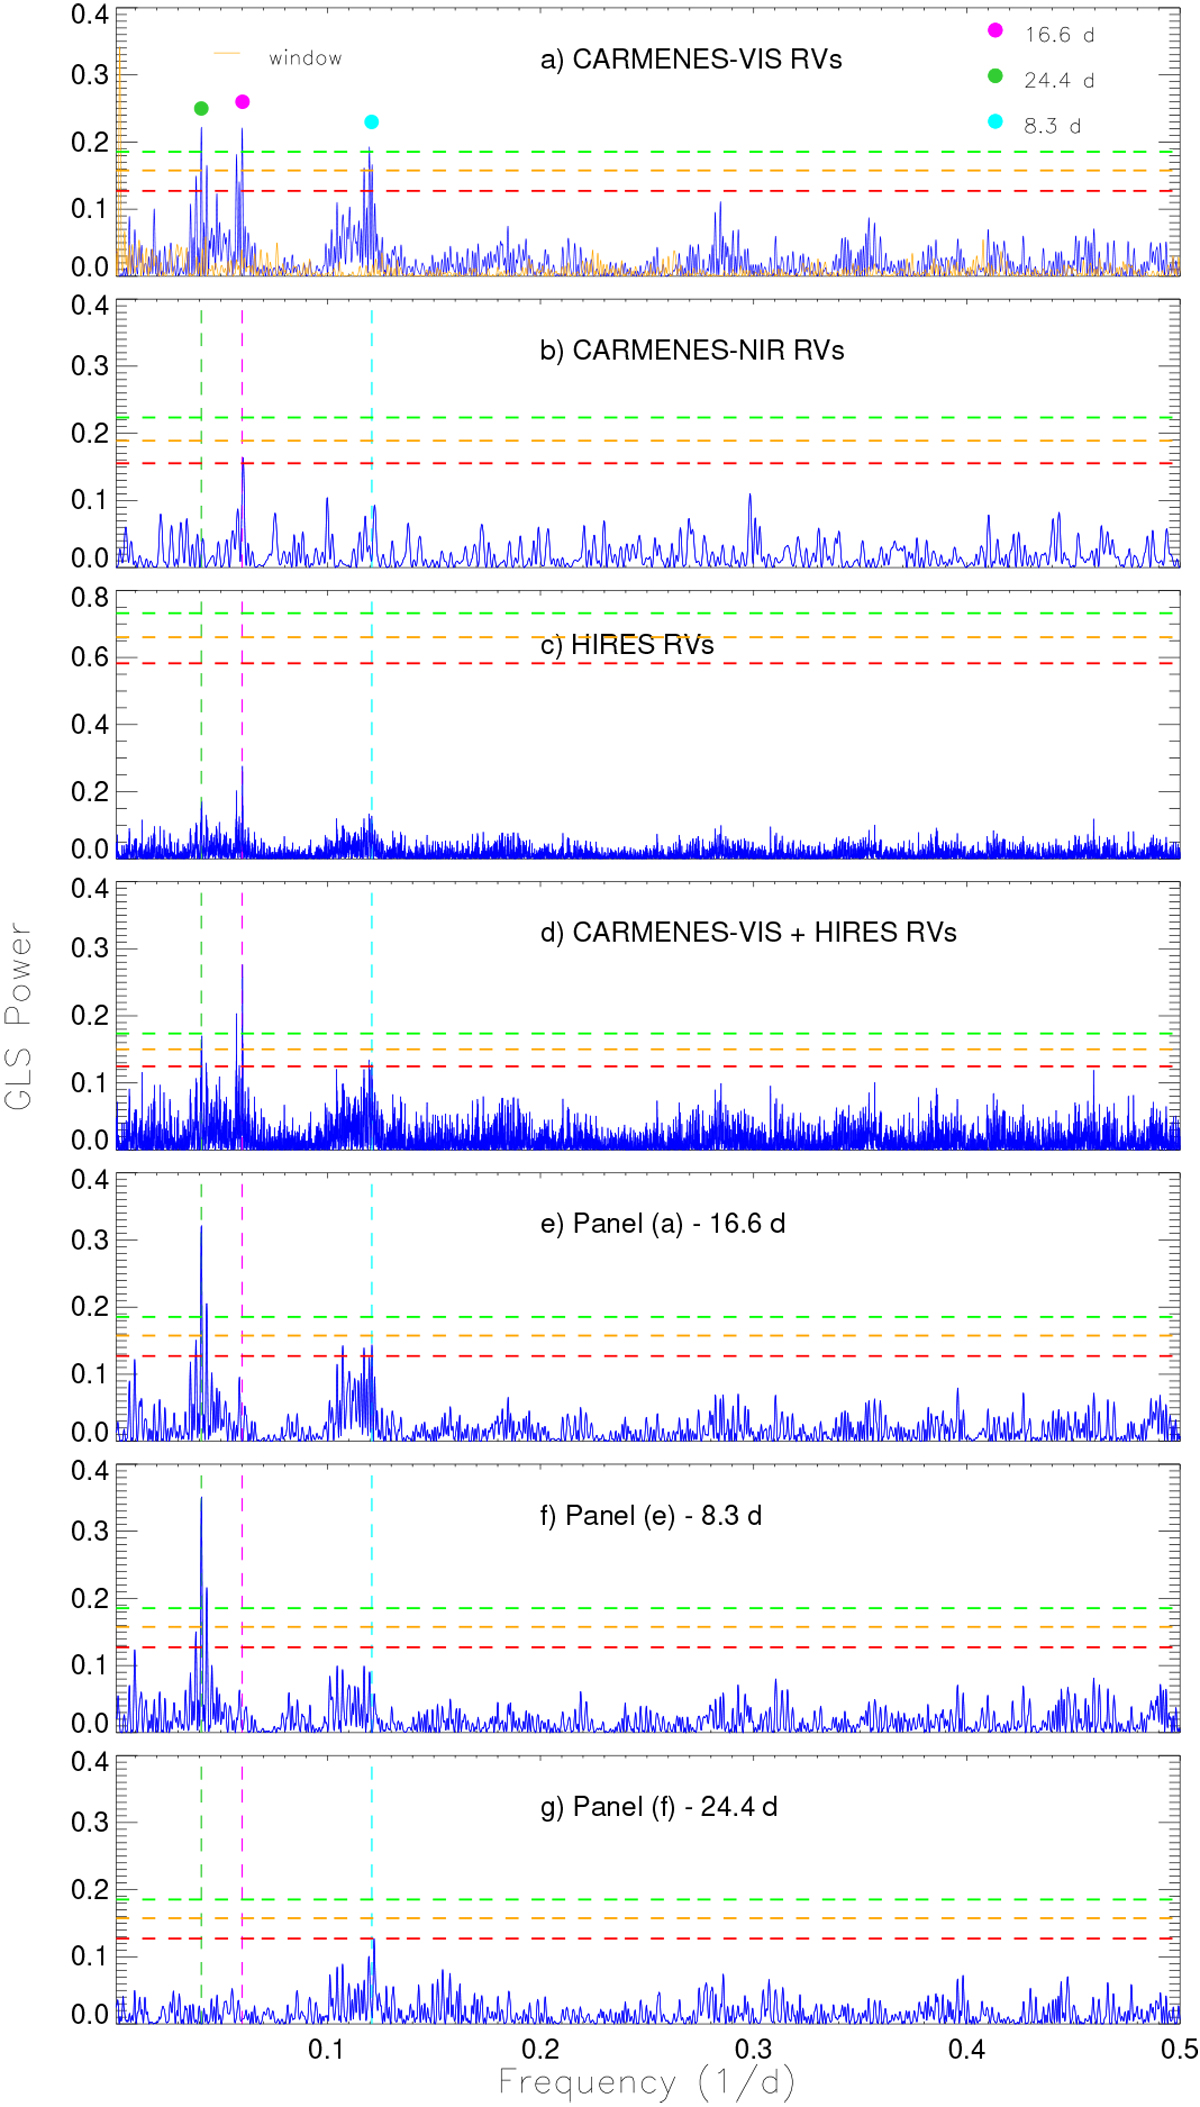
GLS periodograms of the RV data of GJ 338 B. Panel a: periodogram of the CARMENES VIS RVs is plotted as a blue, solid line and the window function of the RV data is shown with an orange line. The three strongest signals are marked in this panel and in all other panels. The horizontal dashed lines indicate FAP levels of 10% (red), 1% (orange), and 0.1% (green). Panel b: peridogram of the CARMENES NIR RVs. Panel c: periodogram of the HIRES RV measurements. Panel d: periodogram of the combined HIRES + CARMENES VIS RV data. Panel e: periodogram of the CARMENES VIS RV residuals after removing the best-fit that modulates the stellar activity at Prot =16.6 d. Panel f: periodogram of the CARMENES VIS RV residuals after removing the stellar rotation and its first harmonic at 8.3 d. Panel g: periodogram of the CARMENES VIS RV residuals after removing all three significant signals.
Current usage metrics show cumulative count of Article Views (full-text article views including HTML views, PDF and ePub downloads, according to the available data) and Abstracts Views on Vision4Press platform.
Data correspond to usage on the plateform after 2015. The current usage metrics is available 48-96 hours after online publication and is updated daily on week days.
Initial download of the metrics may take a while.