Fig. 8
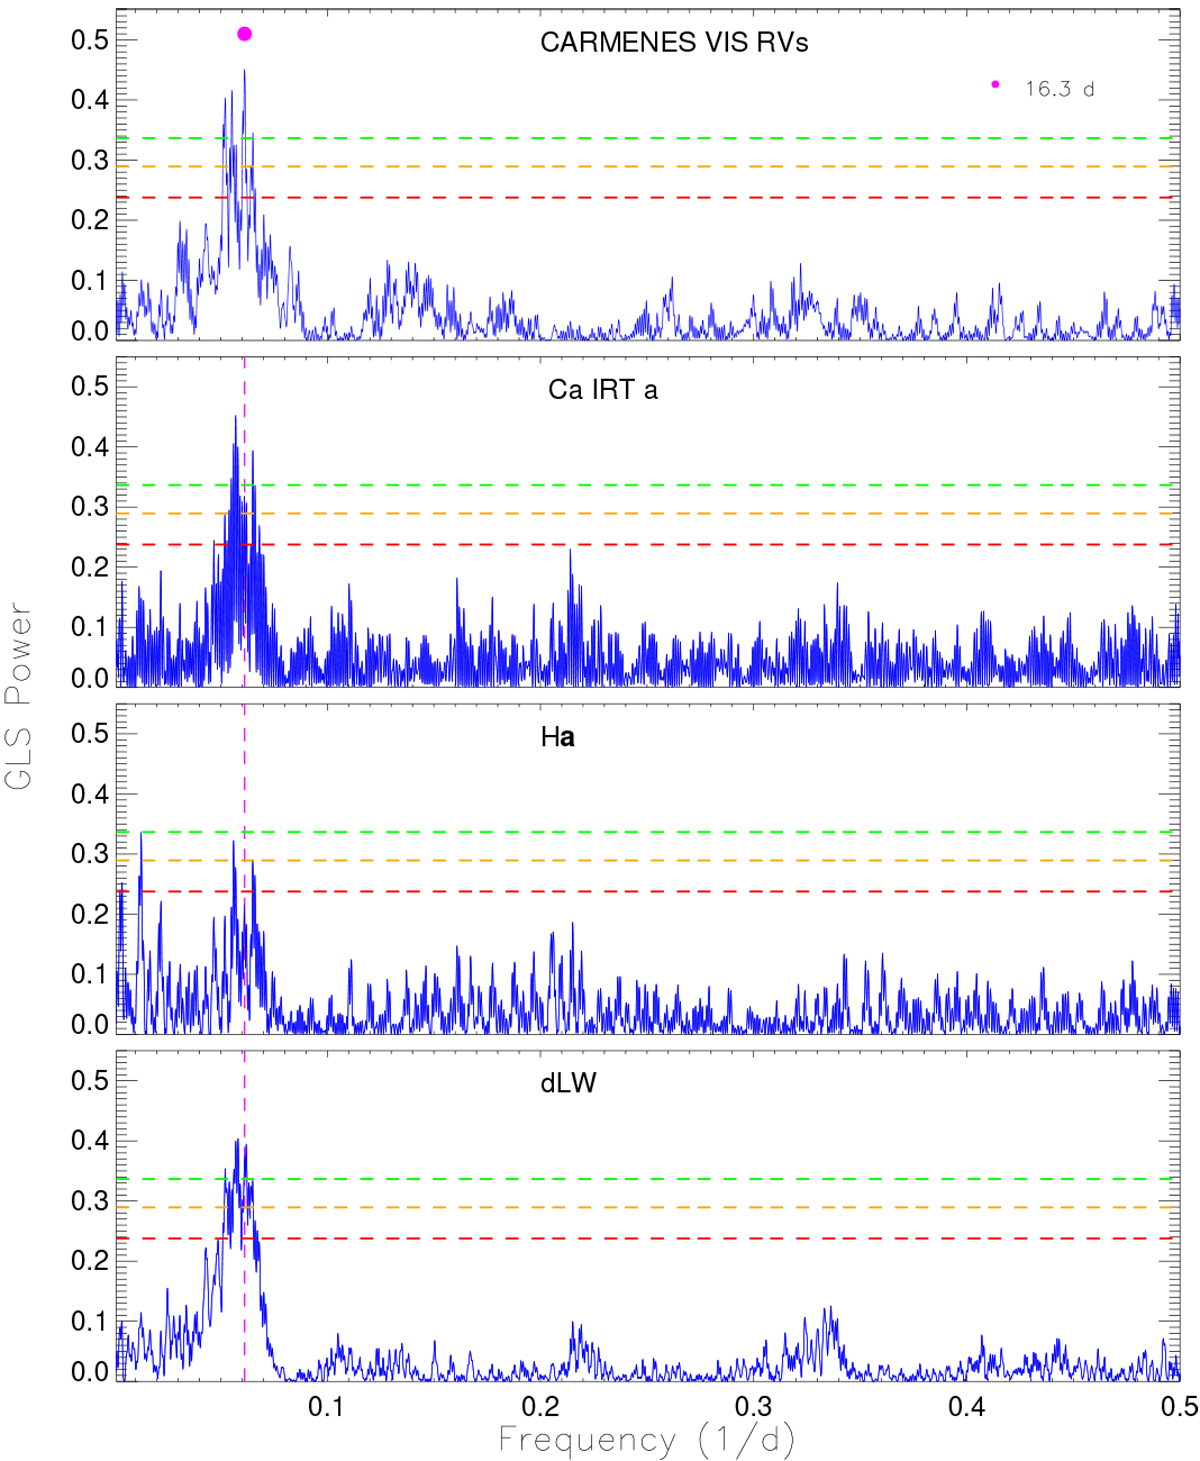
GLS periodograms for GJ 338 A. In all panels, the horizontal dashed lines indicate FAP levels of 10% (red), 1% (orange), and 0.1% (green). Top panel: CARMENES VIS RVs. Second through fourth panels: CARMENES Ca II λ8498 Å, Hα, and dLW spectroscopic activity indicators. All activity indicators and the RV data show a significant, broad peak at around 16.3![]() d. This is likely associated with the rotation period of GJ 338 A.
d. This is likely associated with the rotation period of GJ 338 A.
Current usage metrics show cumulative count of Article Views (full-text article views including HTML views, PDF and ePub downloads, according to the available data) and Abstracts Views on Vision4Press platform.
Data correspond to usage on the plateform after 2015. The current usage metrics is available 48-96 hours after online publication and is updated daily on week days.
Initial download of the metrics may take a while.