Free Access
Fig. 7
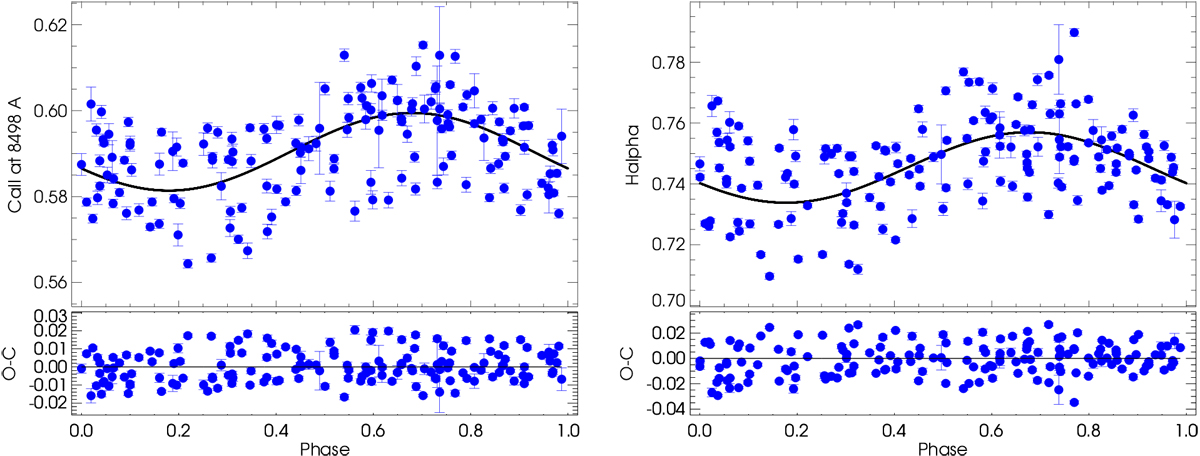
GJ 338 B. Phase-folded time series of activity indicators Ca II λ8498 Å (left) and Hα λ6563 Å (right) and residuals. The solid curve depicts the best sinusoidal fit that modulates the rotation period at 16.6 d.
Current usage metrics show cumulative count of Article Views (full-text article views including HTML views, PDF and ePub downloads, according to the available data) and Abstracts Views on Vision4Press platform.
Data correspond to usage on the plateform after 2015. The current usage metrics is available 48-96 hours after online publication and is updated daily on week days.
Initial download of the metrics may take a while.