Fig. 6
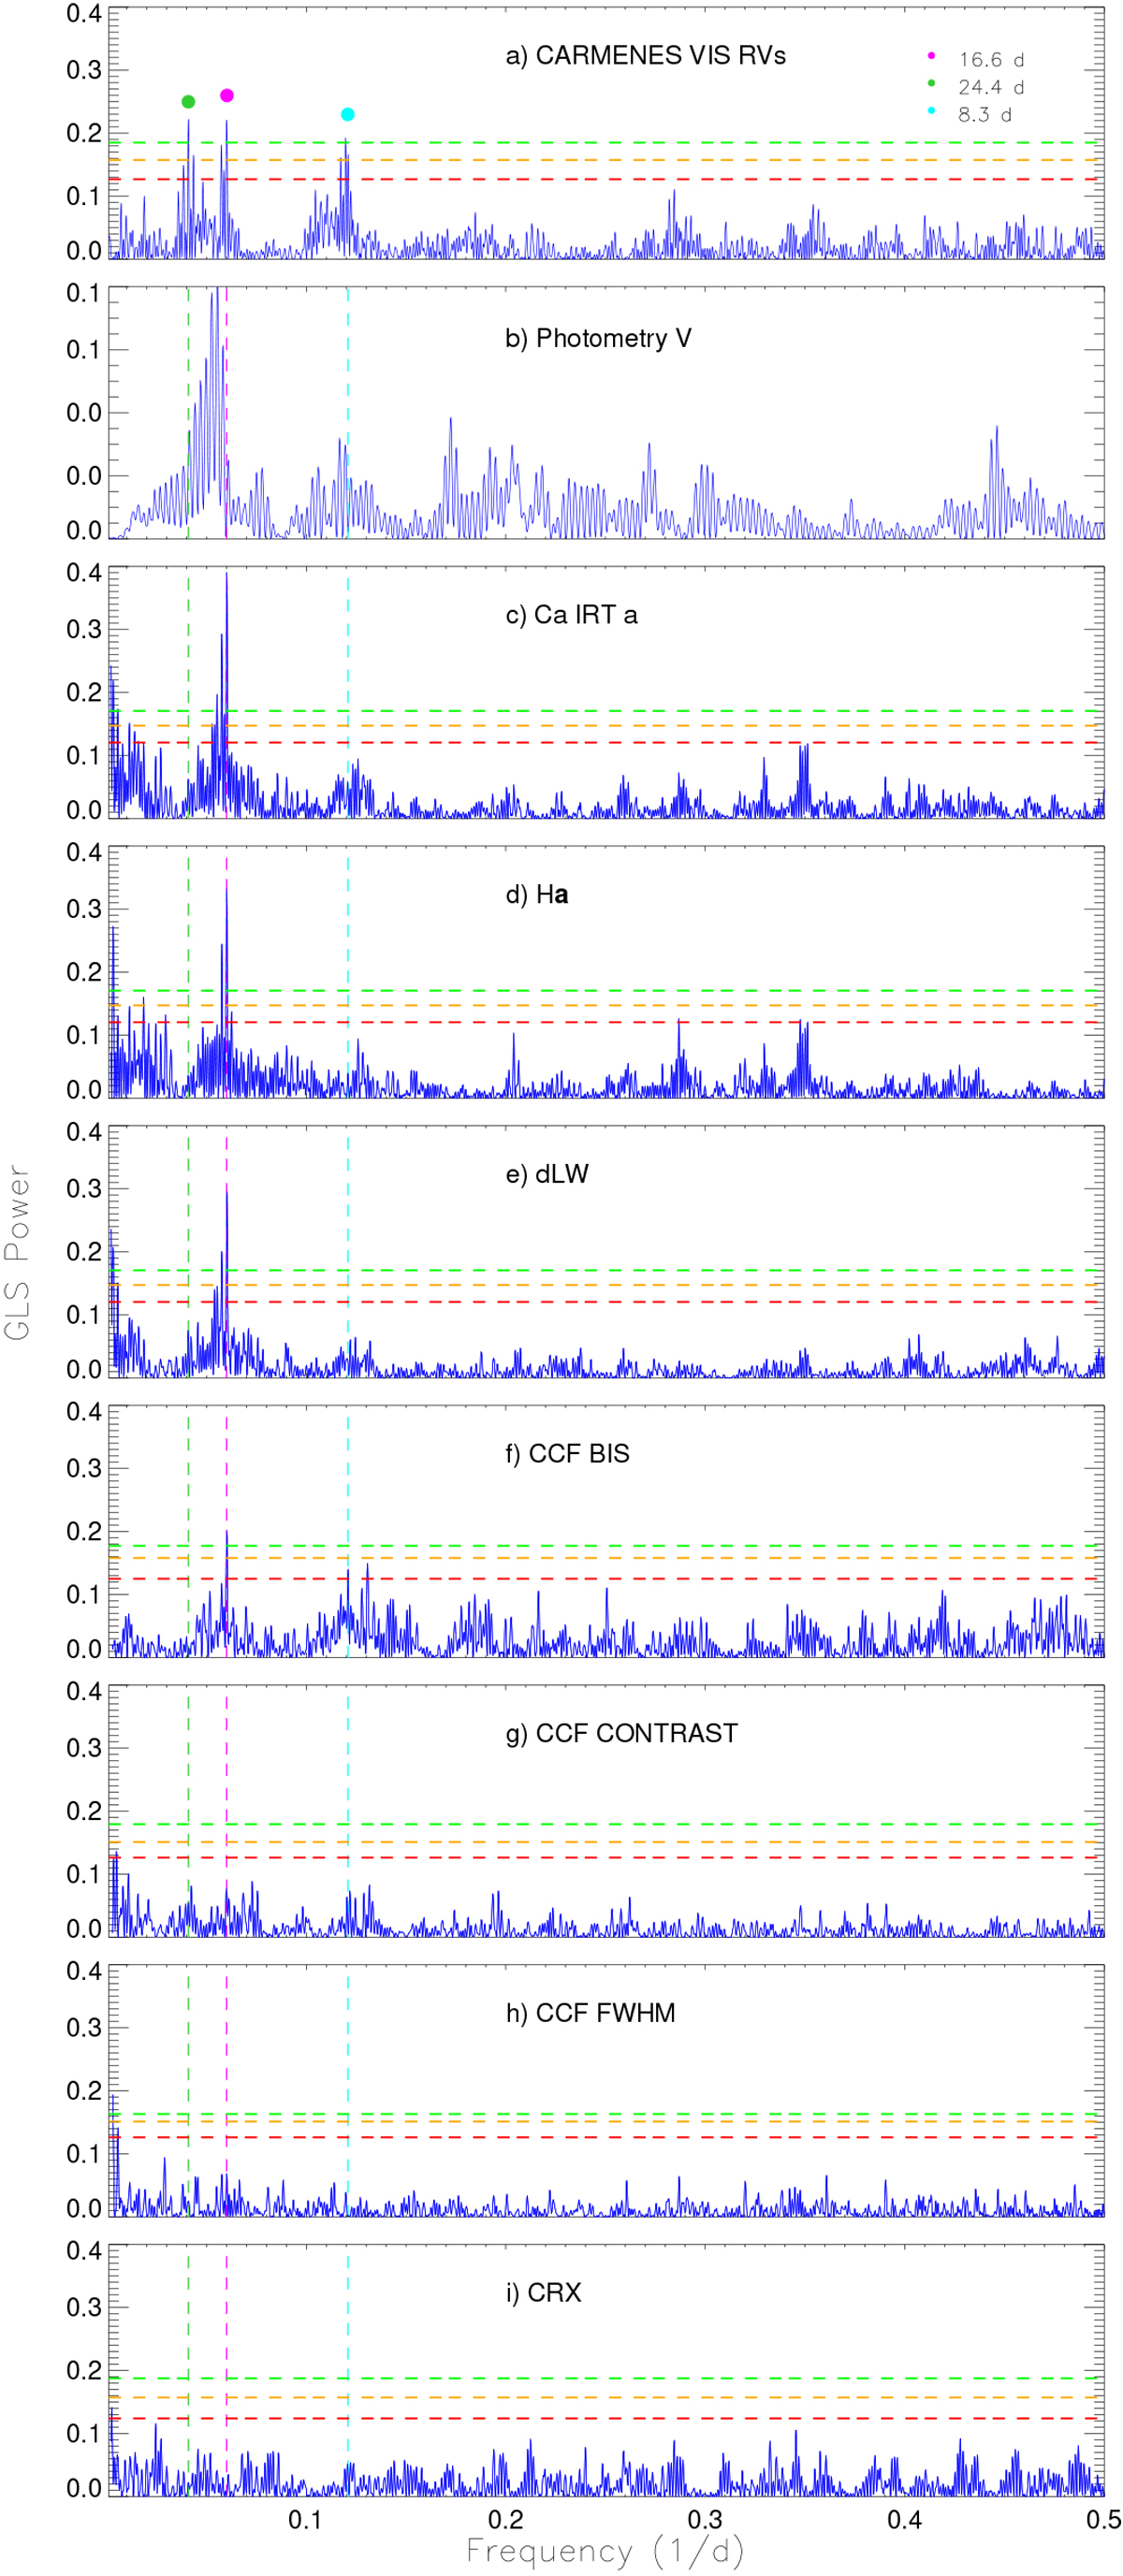
GLS periodograms for GJ 338 B activity and RV data. In all panels, the horizontal dashed lines indicate FAP levels of 10% (red), 1% (orange), and 0.1% (green). Panel a: CARMENES RVs from the VIS channel. The three highest peaks at 8.3, 16.6, and 24.4 d are labeled and their positions are marked in all other panels with vertical dashed lines. Panel b: V -band photometry. Panels c–e: chromospheric line indices of the infrared Ca II triplet, Hα, and dLW. Panels f–h: FWHM, contrast, and bisector velocity span from the CCF analysis. Panel i: chromatic RV index (CRX).
Current usage metrics show cumulative count of Article Views (full-text article views including HTML views, PDF and ePub downloads, according to the available data) and Abstracts Views on Vision4Press platform.
Data correspond to usage on the plateform after 2015. The current usage metrics is available 48-96 hours after online publication and is updated daily on week days.
Initial download of the metrics may take a while.