Fig. 15
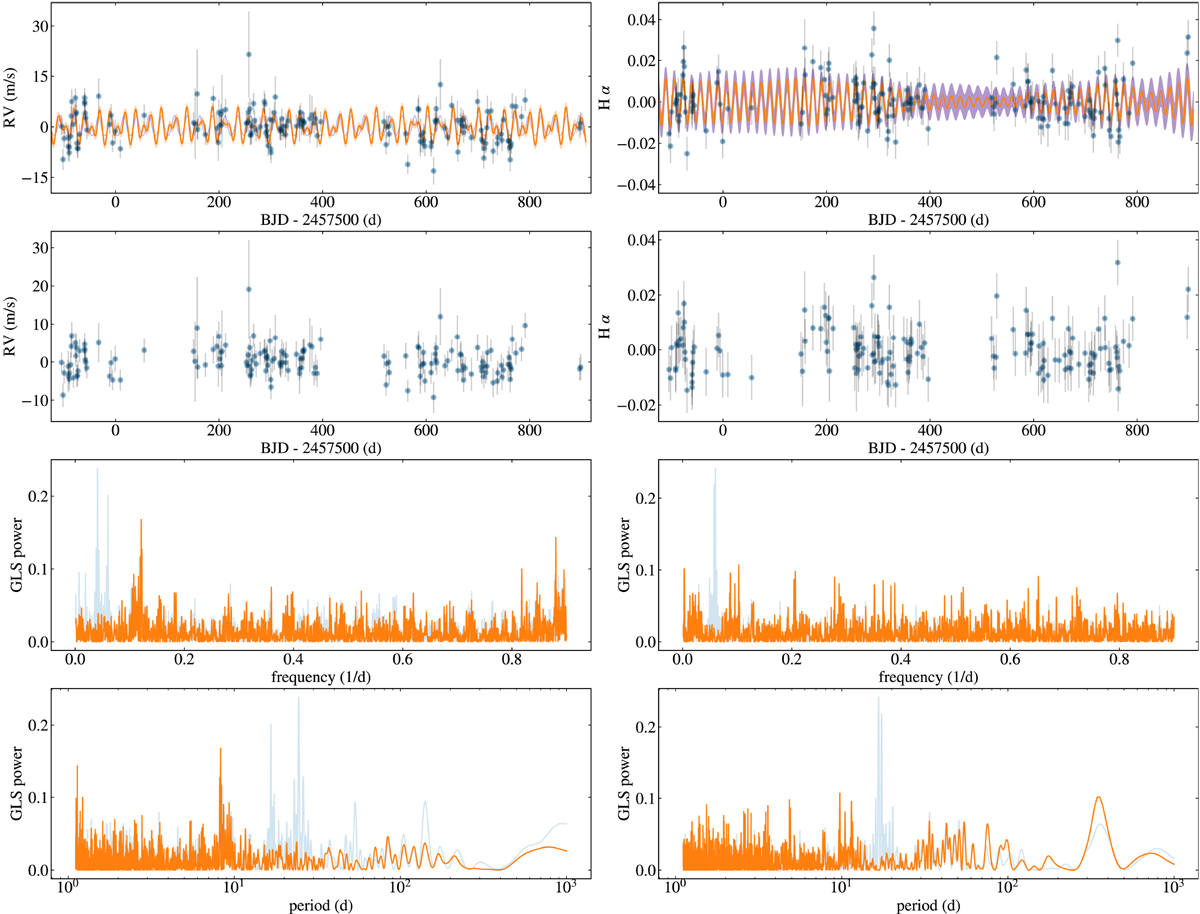
Left panels, top panel: CARMENES VIS RVs (blue dots) together with a Keplerian model combined with a simple-harmonic oscillator (SHO) model shown in orange. The Keplerian-only curve is shown with a light blue color. Second panel: RV residuals after subtracting the combined Keplerian + simple-harmonic oscillator model from the original data. Third and bottom panels: GLS periodograms of the original data (light blue line) and of the RV residuals (orange) as a function of frequency and period. The model accounts for the two strongest peaks at 16.6 d and 24.4 d. Right panels: CARMENES Hα data compared to a simple harmonic oscillator (SHO) model (see Sect. 5.2) and the residuals (top two panels), as well as the periodogram as a function of frequency and period (lower two panels). Top panel: best fit model is shown in orange, the 1σ uncertainty in blue. The periodograms show the data in light blue and the residuals in orange.
Current usage metrics show cumulative count of Article Views (full-text article views including HTML views, PDF and ePub downloads, according to the available data) and Abstracts Views on Vision4Press platform.
Data correspond to usage on the plateform after 2015. The current usage metrics is available 48-96 hours after online publication and is updated daily on week days.
Initial download of the metrics may take a while.