Free Access
Fig. A.2
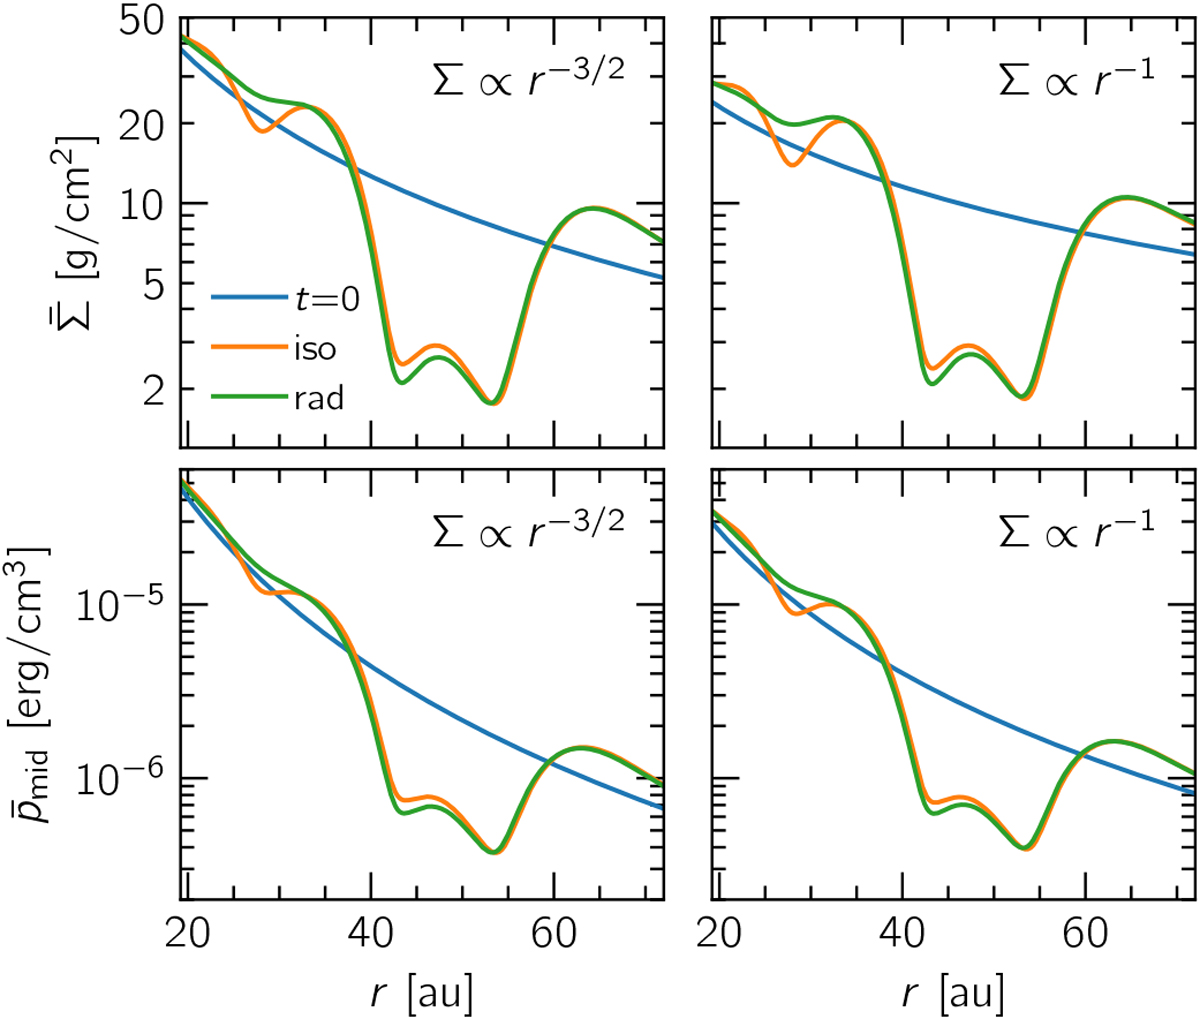
Azimuthally averaged surface density and midplane pressure profiles after 1000 orbits for two comparison tests where disks with different surface density profiles are simulated. Right panels: a shallower surface density profile (Σ0 ∝ r−1 instead of ∝ r−3∕2) is used.
Current usage metrics show cumulative count of Article Views (full-text article views including HTML views, PDF and ePub downloads, according to the available data) and Abstracts Views on Vision4Press platform.
Data correspond to usage on the plateform after 2015. The current usage metrics is available 48-96 hours after online publication and is updated daily on week days.
Initial download of the metrics may take a while.