Fig. 7.
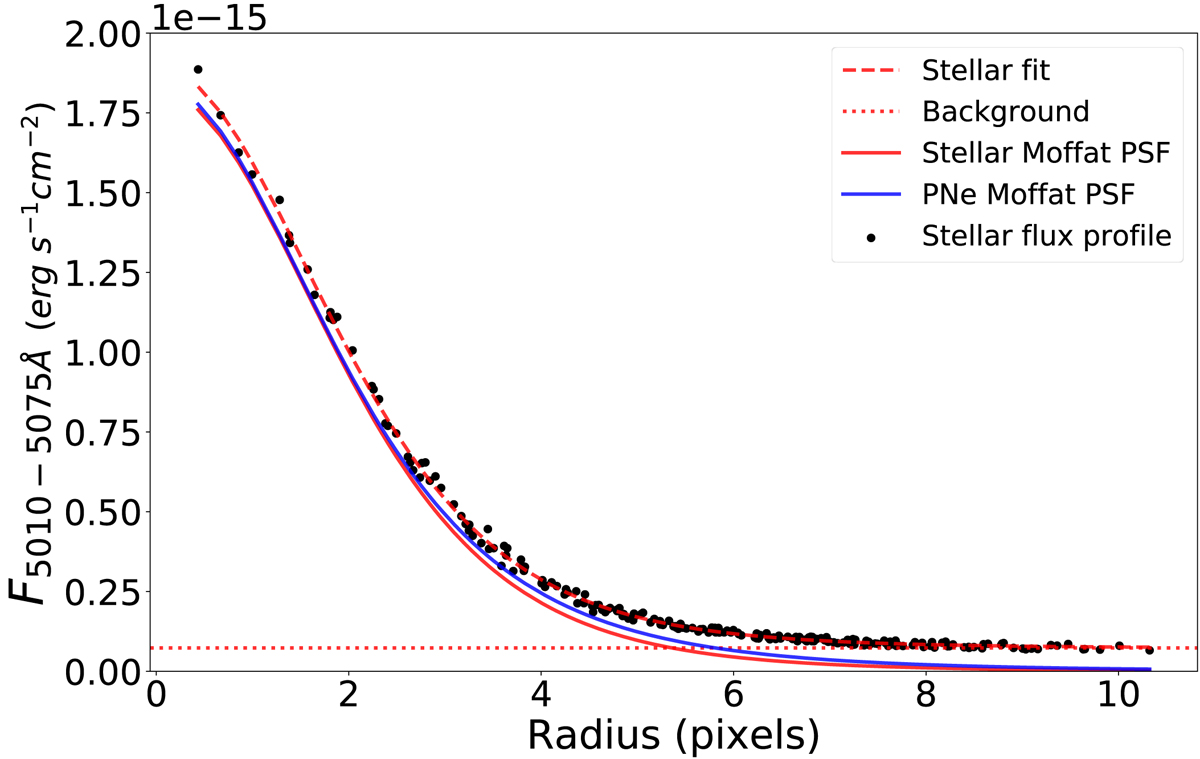
Radial profile of the star within the FOV of FCC 219 (black dots). The best-fit model to the stellar light is shown by the red dashed line, and the red dotted line indicates the background level of galaxy light. The solid red and blue lines depict the actual PSF, without background, as described by the star and PNe, respectively. For the total flux and profile, this comparison highlights that the two approaches agree well.
Current usage metrics show cumulative count of Article Views (full-text article views including HTML views, PDF and ePub downloads, according to the available data) and Abstracts Views on Vision4Press platform.
Data correspond to usage on the plateform after 2015. The current usage metrics is available 48-96 hours after online publication and is updated daily on week days.
Initial download of the metrics may take a while.