Fig. 6.
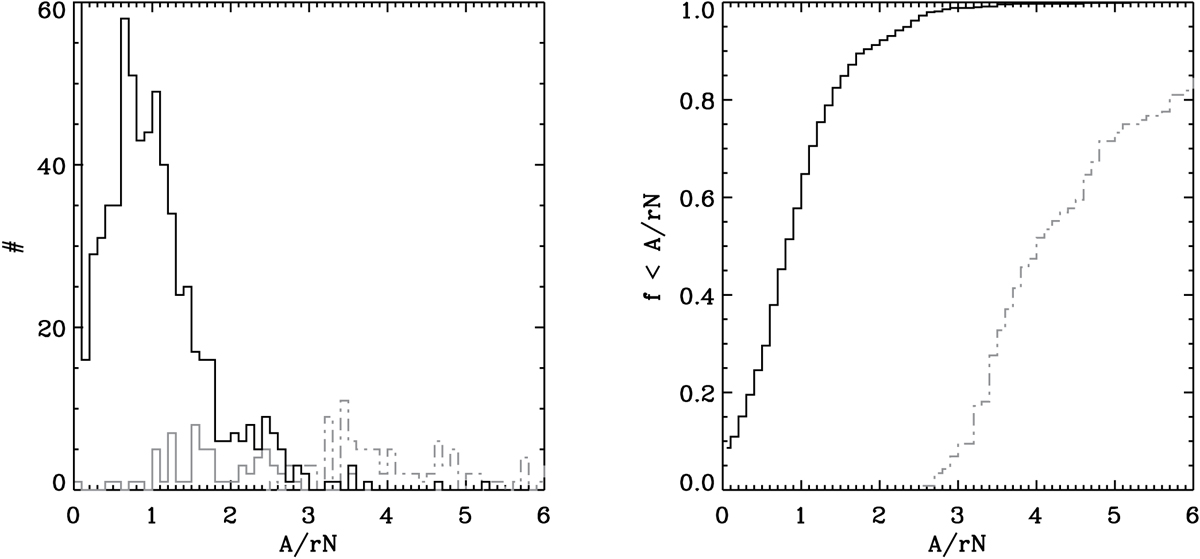
Central A/rN values from 1D+2D-fits to regions devoid of emission in FCC 167. Left: observed distribution of false-positive A/rN values. The grey line shows the values corresponding to regions closer to the centre, where template mismatches in the emission line cube systematically bias the A/rN values to higher values. For comparison, the dot-dashed grey lines also show the distribution of A/rN values for our candidate sources. Right: cumulative distribution for the false-positive A/rN values, 99% of which lie below A/rN = 3. A/rN values corresponding to poor fits are excluded.
Current usage metrics show cumulative count of Article Views (full-text article views including HTML views, PDF and ePub downloads, according to the available data) and Abstracts Views on Vision4Press platform.
Data correspond to usage on the plateform after 2015. The current usage metrics is available 48-96 hours after online publication and is updated daily on week days.
Initial download of the metrics may take a while.