Fig. 5.
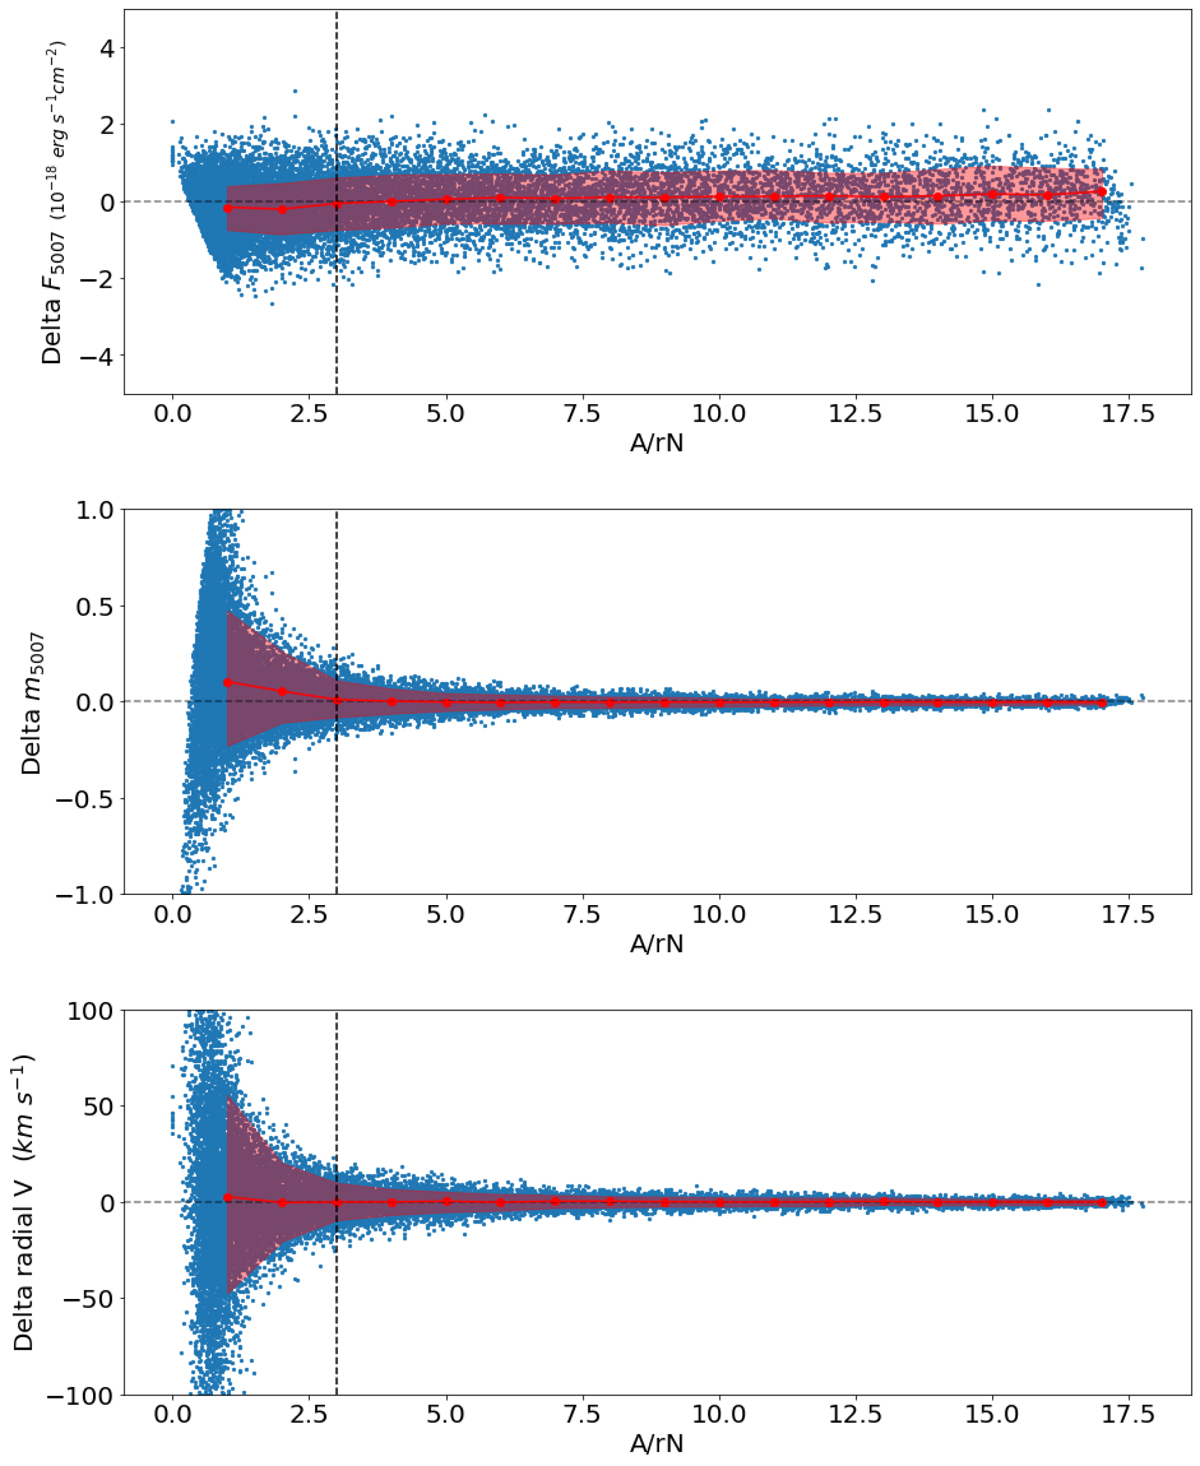
Simulation results when the PSF values of FWHM and β are known and held constant. Top row, first panel: delta Flux of [O III] against fitted A/rN value of each source. Top row, second panel: delta M5007 against source A/rN. Top row, third panel: delta radial velocity as measured from the offset of the [O III] emission line. The red points are the median value binned by A/rN. The upper and lower parts of the red region indicate the 86th and 16th percentile, respectively.
Current usage metrics show cumulative count of Article Views (full-text article views including HTML views, PDF and ePub downloads, according to the available data) and Abstracts Views on Vision4Press platform.
Data correspond to usage on the plateform after 2015. The current usage metrics is available 48-96 hours after online publication and is updated daily on week days.
Initial download of the metrics may take a while.