Fig. 4.
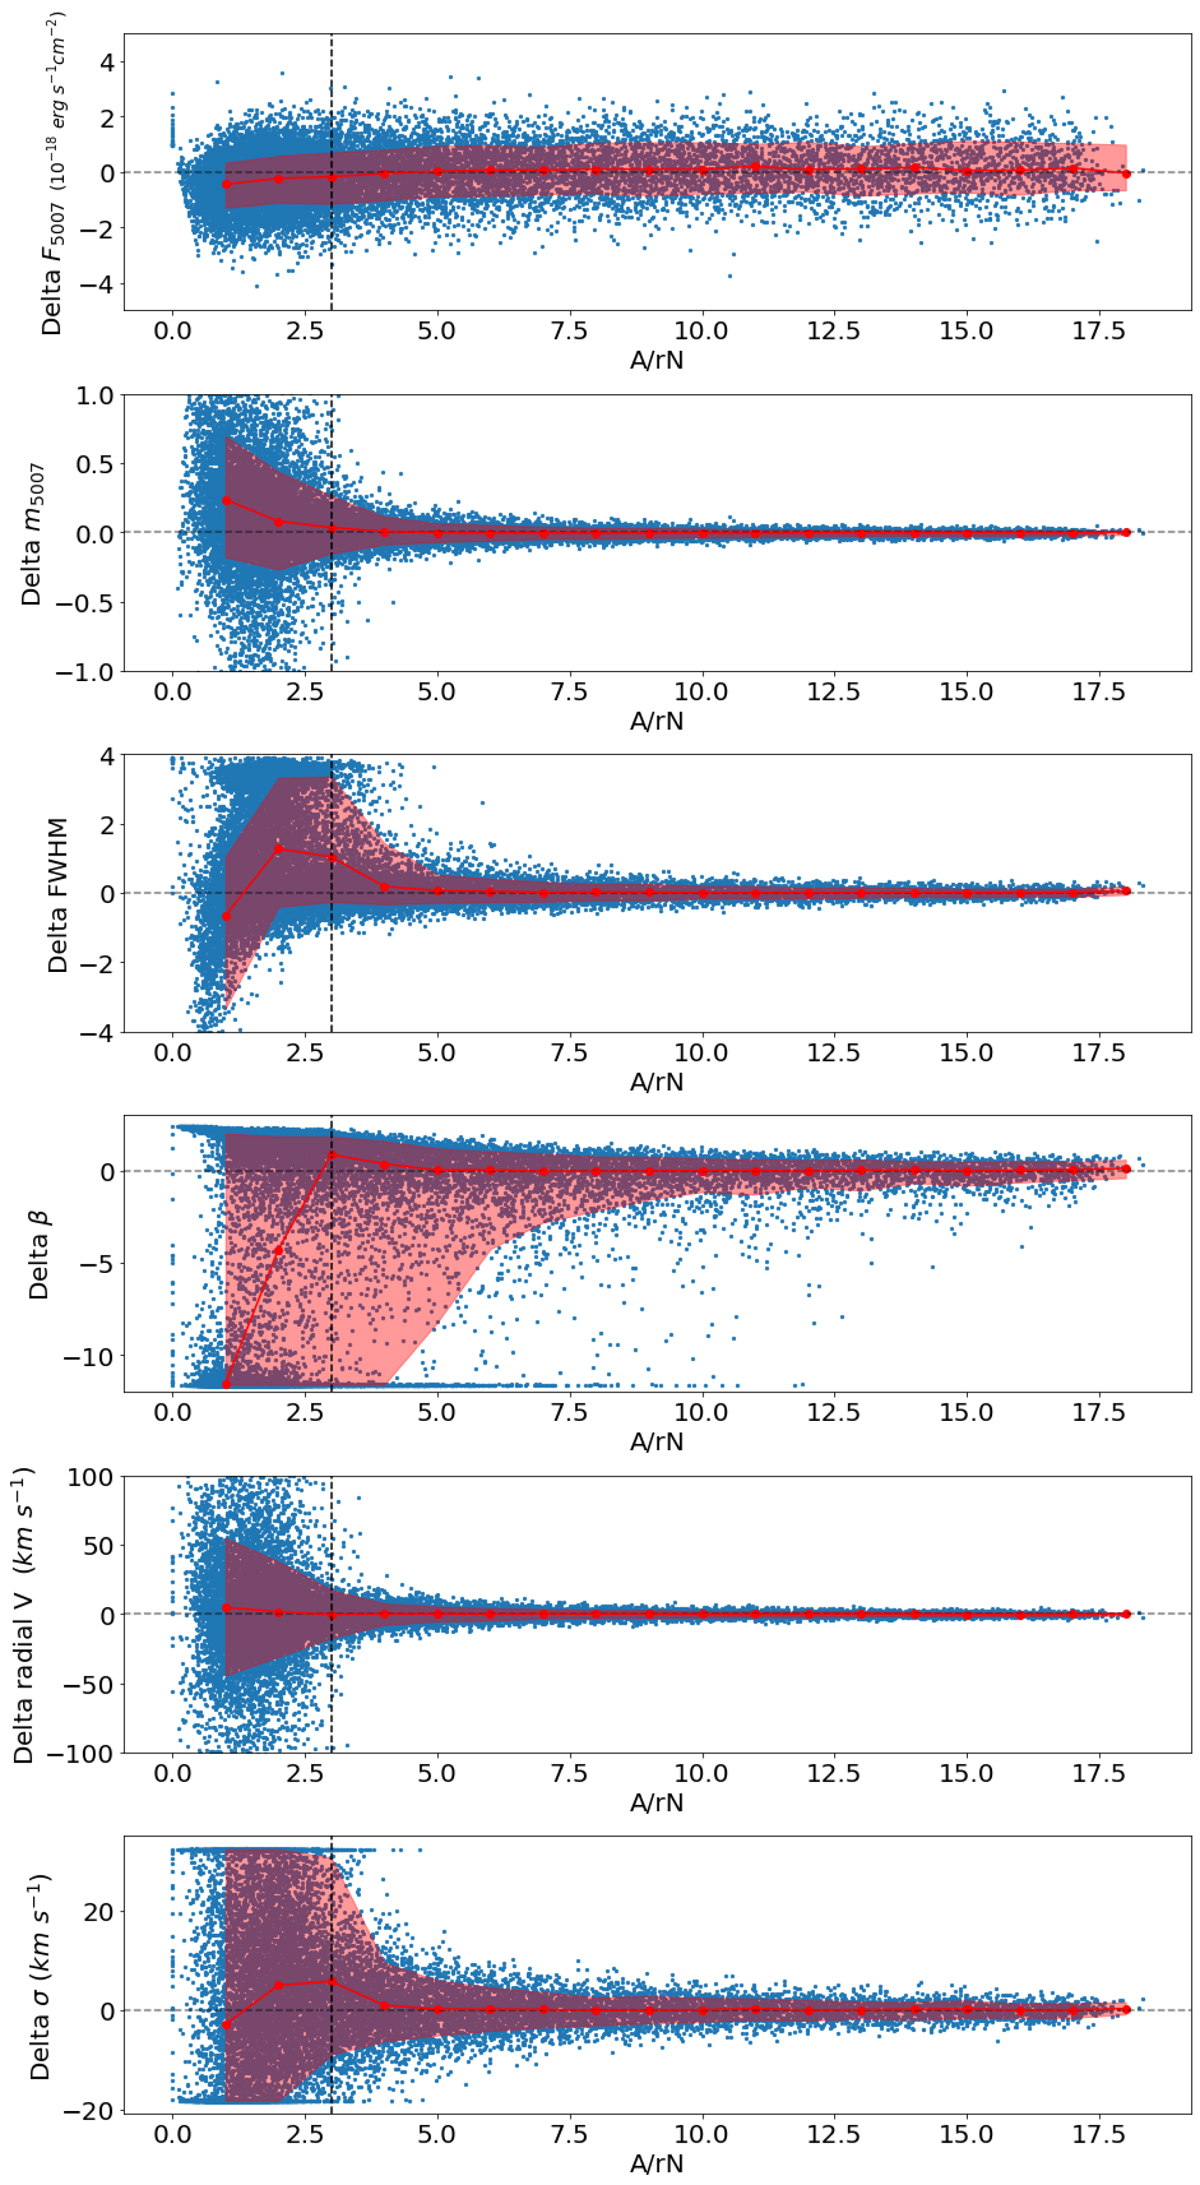
Simulation of the detection and retrieval of PSF parameters FWHM and β, and determination of the accuracy of the model fits for the total flux of a source. The blue points show the individual simulation results, and the red points show the median values, binned in A/rN. The upper and lower parts of the red region indicate the 86th and 16th percentile, respectively. Top row, first panel: delta [O III] flux. Top row, second panel: delta M5007. Top row, third panel: delta FWHM. Top row, fourth panel: delta β. Top row, fifth panel: delta radial velocity derived from wavelength position. Top row, sixth panel: delta velocity dispersion of the [O III] emission lines.
Current usage metrics show cumulative count of Article Views (full-text article views including HTML views, PDF and ePub downloads, according to the available data) and Abstracts Views on Vision4Press platform.
Data correspond to usage on the plateform after 2015. The current usage metrics is available 48-96 hours after online publication and is updated daily on week days.
Initial download of the metrics may take a while.