Fig. 3.
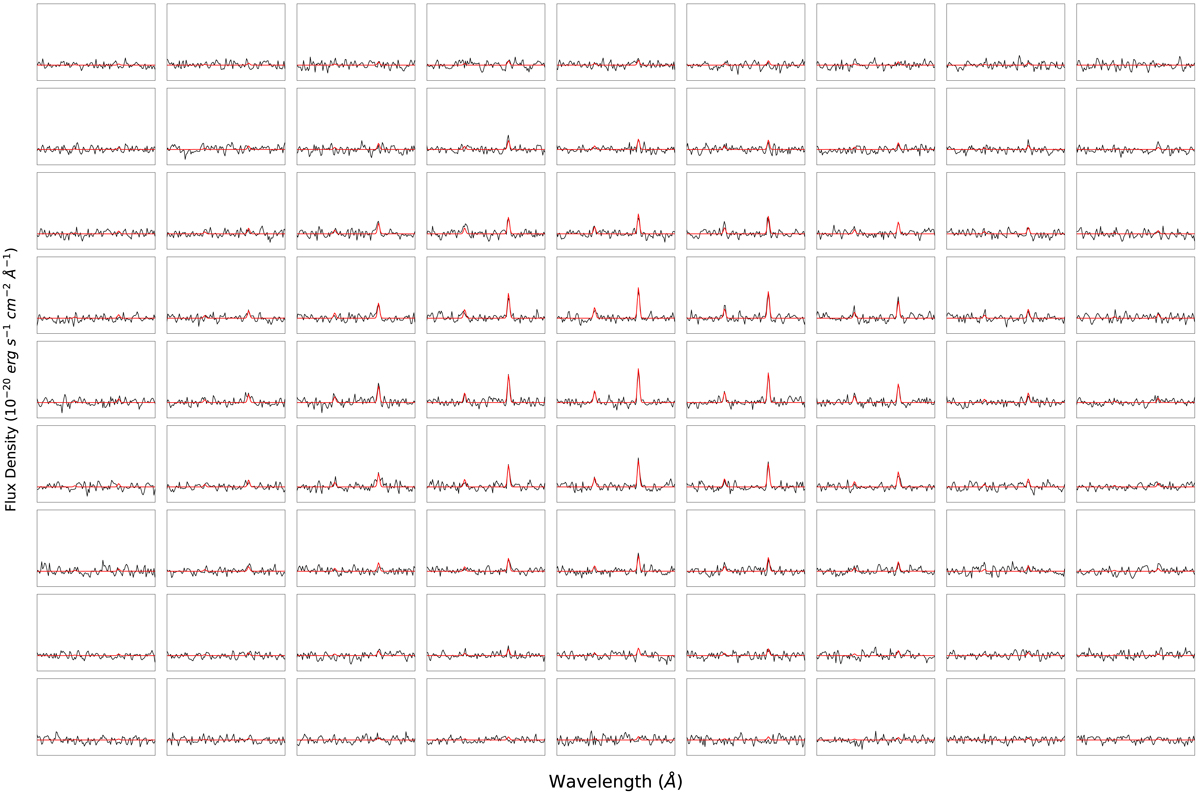
Example of an outcome from our 3D fitting for one PNe source (61), located in the central region of FCC 219 (see Fig. 2). For each of the 9 × 9 spaxels plotted, the corresponding wavelength range spans 4950–5080 Å. The scale of the y-axis is chosen arbitrarily to best illustrate our fits. Spectral data are shown in black, and our [O III] model is shown in red. The entire 9 × 9 spaxel region is displayed to highlight the expected variation in signal (central pixels) and noise (outer pixels). Each spaxel corresponds to a spatial scale of 0.2 arcsec.
Current usage metrics show cumulative count of Article Views (full-text article views including HTML views, PDF and ePub downloads, according to the available data) and Abstracts Views on Vision4Press platform.
Data correspond to usage on the plateform after 2015. The current usage metrics is available 48-96 hours after online publication and is updated daily on week days.
Initial download of the metrics may take a while.