Fig. 16.
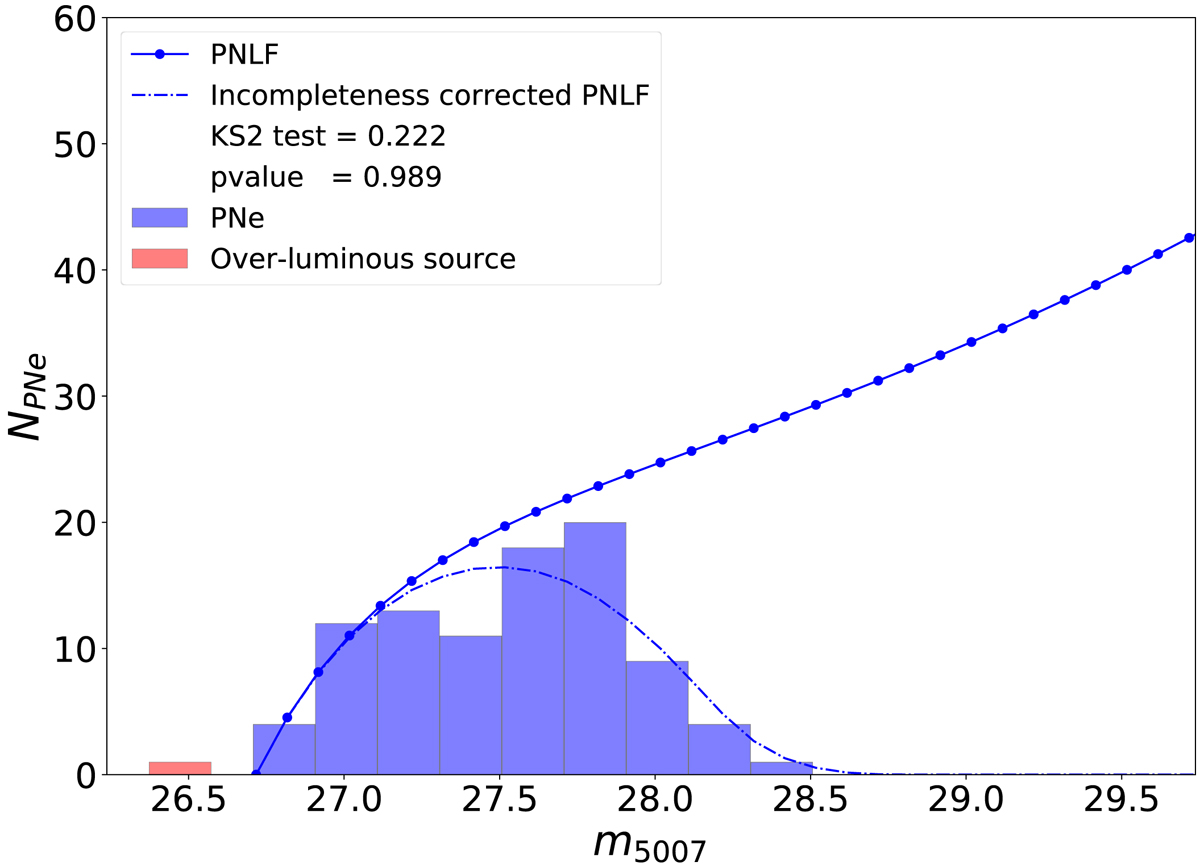
PNLF for FCC 167 given by the binned values of m5007 from the PNe population. The blue solid line indicates the empirical form of the PNLF, given by Eq. (8), and the completeness-corrected PNLF is depicted by the dashed line. The two curves are normalised such that the integral of the incompleteness-corrected PNLF matches the total number of observed PNe.
Current usage metrics show cumulative count of Article Views (full-text article views including HTML views, PDF and ePub downloads, according to the available data) and Abstracts Views on Vision4Press platform.
Data correspond to usage on the plateform after 2015. The current usage metrics is available 48-96 hours after online publication and is updated daily on week days.
Initial download of the metrics may take a while.