Free Access
Fig. 15.
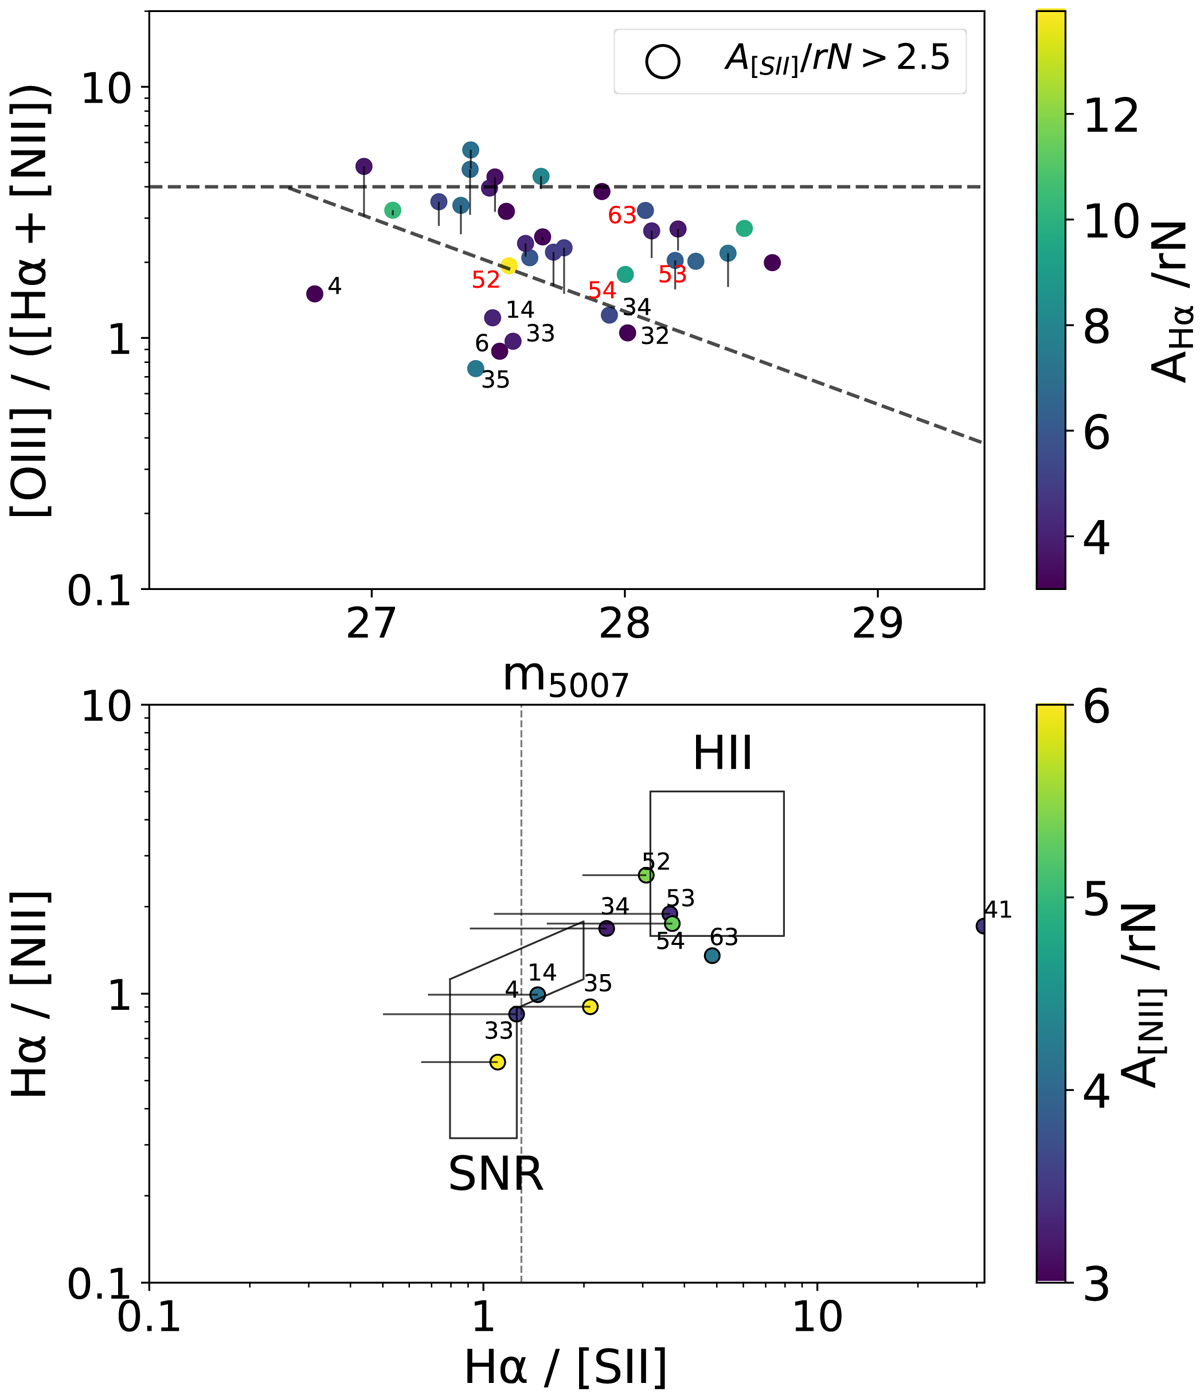
Contamination diagrams for FCC 219 obtained with the same procedure and diagnostics as in Fig. 14. Top panel: fewer sources reside outside of the dashed lines (from Eq. (7)), and no sources exhibit [S II] emission at a signal-to-noise higher than 4. The points are again numbered to help identify sources in the two plots.
Current usage metrics show cumulative count of Article Views (full-text article views including HTML views, PDF and ePub downloads, according to the available data) and Abstracts Views on Vision4Press platform.
Data correspond to usage on the plateform after 2015. The current usage metrics is available 48-96 hours after online publication and is updated daily on week days.
Initial download of the metrics may take a while.