Fig. 14.
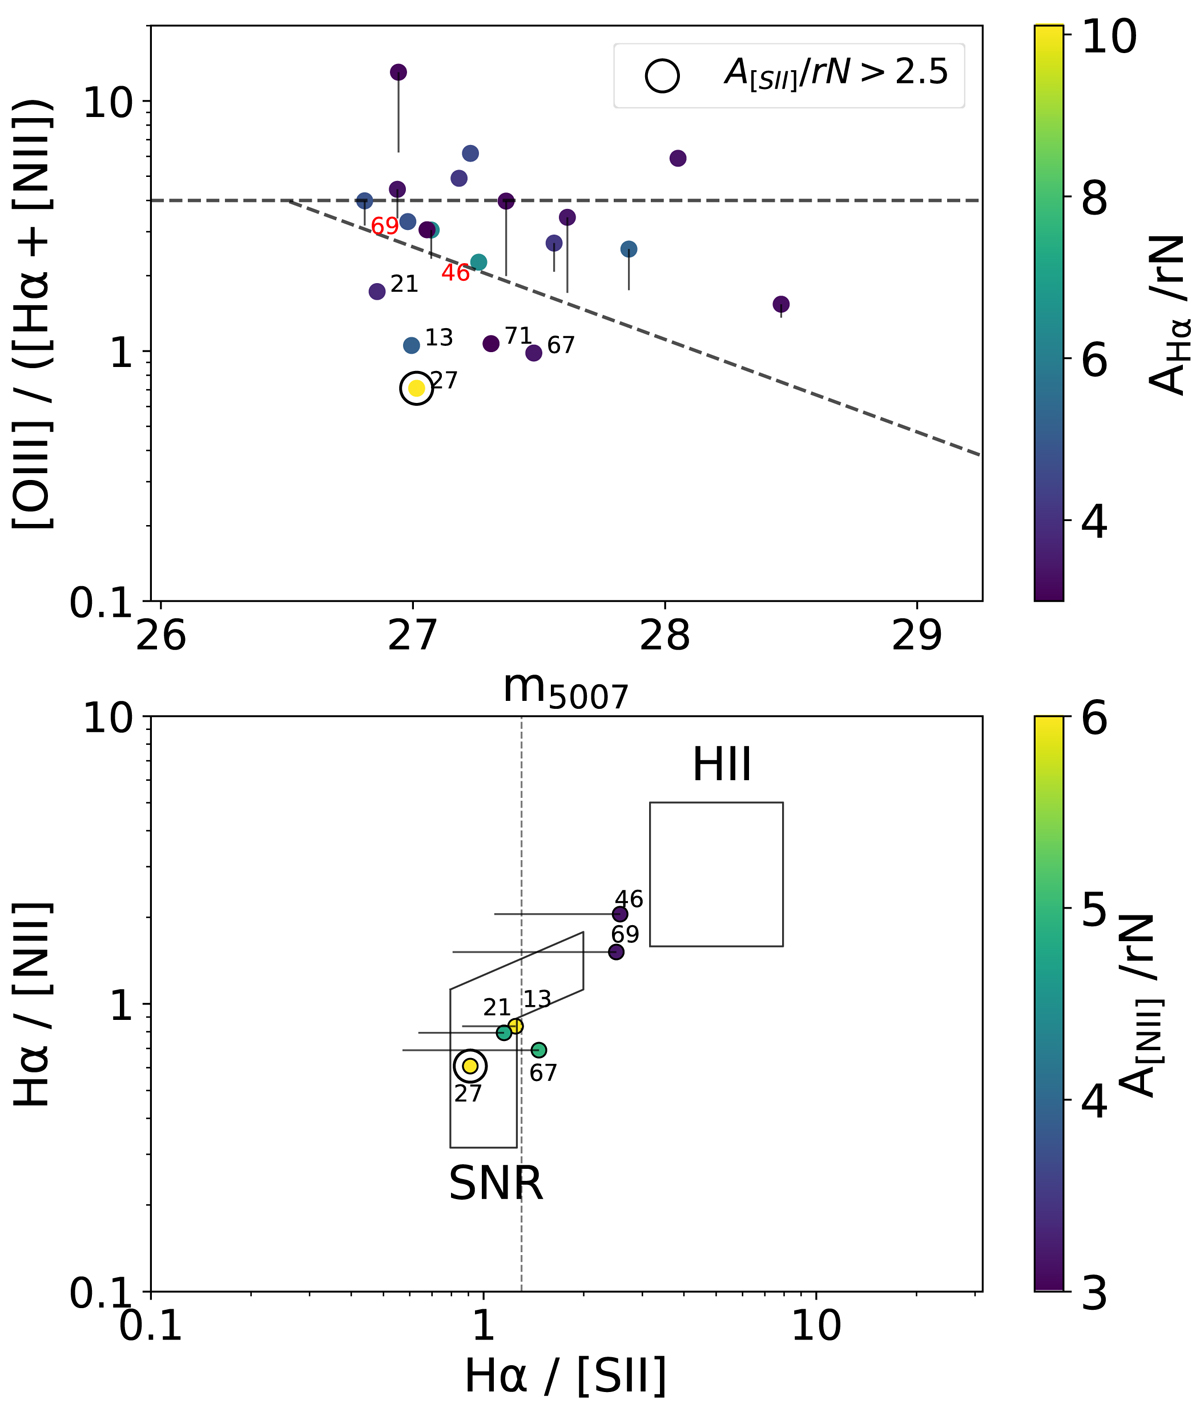
Contamination diagrams for FCC 167. Top panel: values for the [O III]/(Hα+[N II]) line ratio for the PNe candidate sources, as returned from our spectral fit and only for objects that were already validated for fit quality and detectability. The symbols are colour-coded according to the level of the signal-to-noise ratio of Hα, which is the predominant line of the Hα [N II] pairing. The sources included here passed either the AHα/rN > 3 or the A[N II]/rN > 3 filter. When this is not the case, a vertical line points to the corresponding lower limit for [O III]/(Hα+[N II]), assuming an upper limit in the [N II] flux corresponding to a A[[N II]+Hα/rN = 3. When a distance modulus of 31.24 mag is assumed (Sect. 5), the dashed lines show the region typically occupied by PNe according to Ciardullo et al. (2002) and Herrmann et al. (2008). Lower panel: position of the PNe sources with firmly detected [N II] and Hα emission in the Sabbadin et al. (1977) diagnostic diagram in which the regions occupied by PNe (from Riesgo & López 2006), SNRs and unresolved H II-regions. Similar to the top panel, horizontal lines indicate the range of values down to a lower limit for the Hα/[S II] ratio where the [S II] doublet is not formally detected. Sources detected with S II/rN > 3 are highlighted by a circle. One such source is found within FCC 167. Sources are numbered to show where they lie in relation to each other within the two diagnostic diagrams.
Current usage metrics show cumulative count of Article Views (full-text article views including HTML views, PDF and ePub downloads, according to the available data) and Abstracts Views on Vision4Press platform.
Data correspond to usage on the plateform after 2015. The current usage metrics is available 48-96 hours after online publication and is updated daily on week days.
Initial download of the metrics may take a while.