Fig. 10.
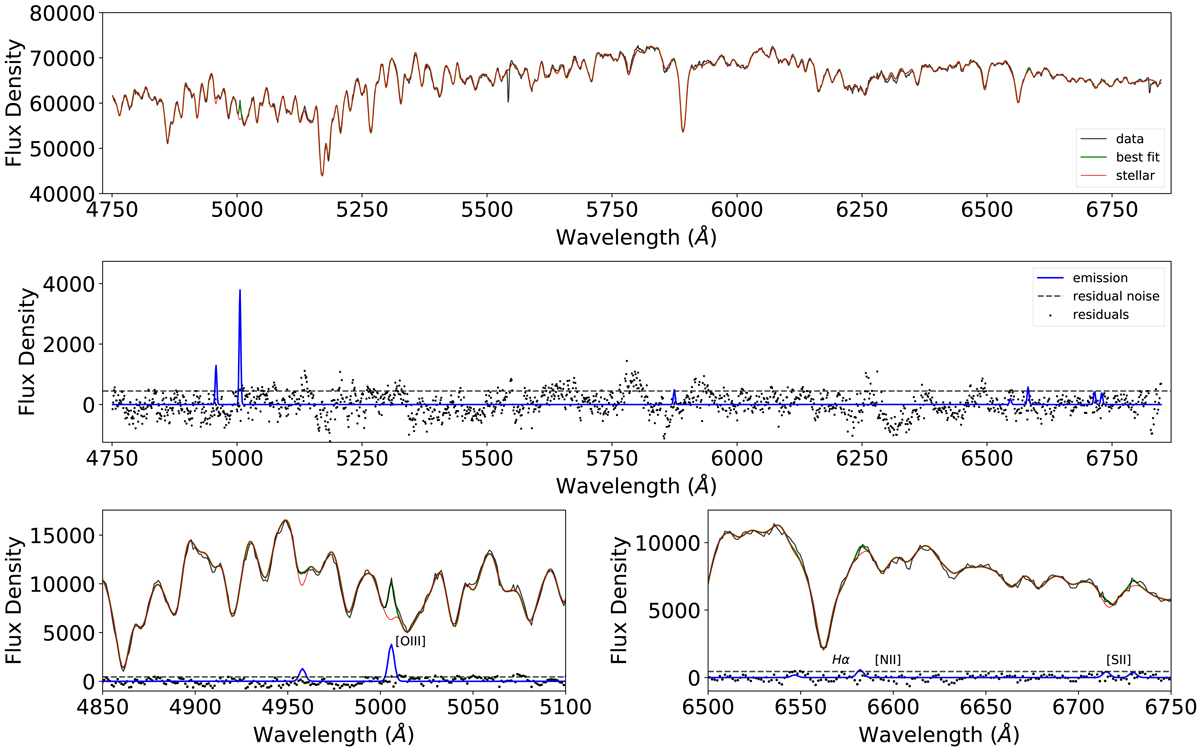
GandALF fit to the typical spectrum (green) of a PNe source (black line, top plot) from FCC 167 (F3D J033627.08-345832.69), and its galaxy stellar background (red), showing strong [O III] lines and some Hα emission. Middle plot: emission lines as detected by GandALF (blue). The dashed horizontal line indicates the level of residual noise (standard deviation of the residuals from stellar subtraction (black points)). Lower left panel: zooms into the Hβ and [O III] doublet wavelength region, and lower right panel: region occupied by Hα and the [N II] and [S II] doublets. The data, best fit, and stellar spectra shown in the bottom two plots are subtracted by an arbitrary number to better present and compare the fit of the nebulous and stellar emissions within each region.
Current usage metrics show cumulative count of Article Views (full-text article views including HTML views, PDF and ePub downloads, according to the available data) and Abstracts Views on Vision4Press platform.
Data correspond to usage on the plateform after 2015. The current usage metrics is available 48-96 hours after online publication and is updated daily on week days.
Initial download of the metrics may take a while.