Fig. 1.
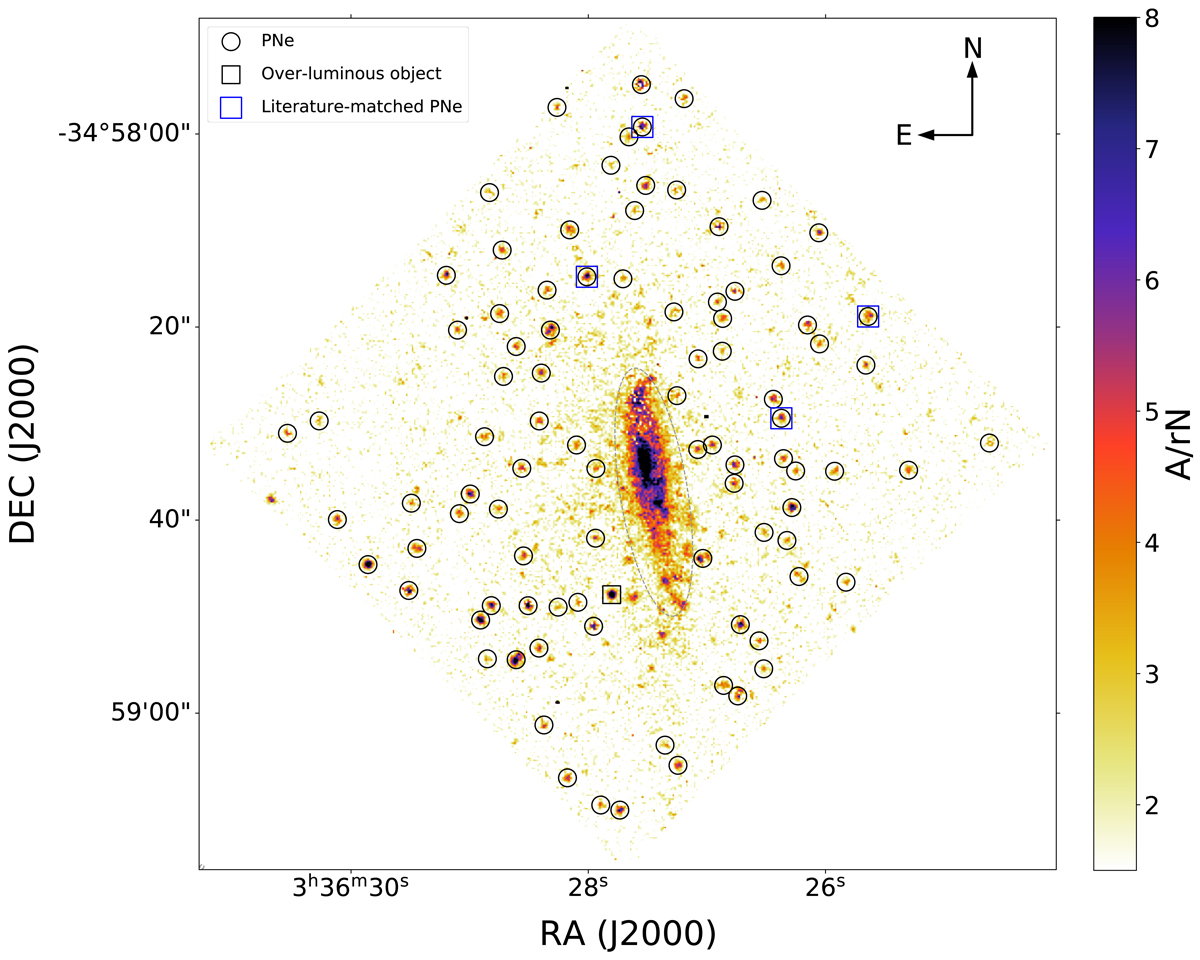
FCC 167: map of the peak amplitude to residual-noise level ratio (A/rN) of the [O III]5007 line, based on our spaxel-by-spaxel fit for the [O III] doublet in the emission datacube. The sources detected and labelled PNe are shown by a black circle. The over-luminous object (see Sect. 5.1) is highlighted by a black square. The PNe that mach those reported by Feldmeier et al. (2007) are highlighted by blue squares. The dashed ellipsoid marks the central region that was disregarded owing to the presence of diffuse ionised-gas emission (see also Viaene et al. 2019).
Current usage metrics show cumulative count of Article Views (full-text article views including HTML views, PDF and ePub downloads, according to the available data) and Abstracts Views on Vision4Press platform.
Data correspond to usage on the plateform after 2015. The current usage metrics is available 48-96 hours after online publication and is updated daily on week days.
Initial download of the metrics may take a while.