Fig. 6.
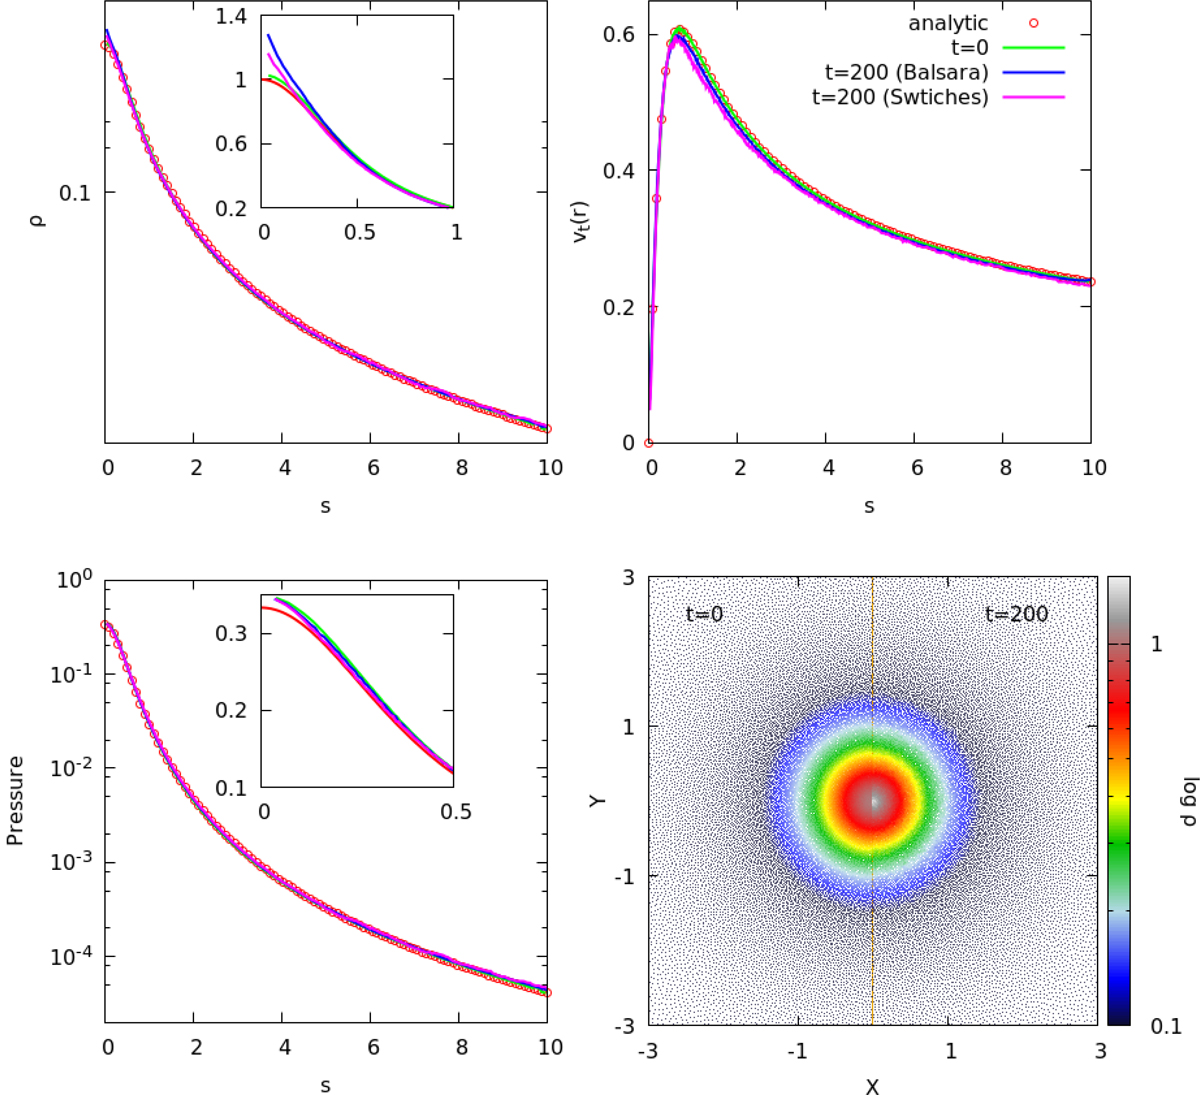
Profiles of density, tangential velocity, and pressure of the disk after the relaxation period (green lines) compared to the analytic values (in red) and after t = 200 s calculated with the Balsara limiter (blue) or the AV switches by Read & Hayfield (2012) (magenta). Bottom right panel: density color map in the central region of the disk. The left semi-plane (x < 0) is for the relaxed model at t = 0 s; the right semi-plane (x ≥ 0) shows the density color map after t = 200 s, with the Balsara limiter. Unlike in Raskin & Owen (2016), the SPH particles are still settled in a glass-like configuration.
Current usage metrics show cumulative count of Article Views (full-text article views including HTML views, PDF and ePub downloads, according to the available data) and Abstracts Views on Vision4Press platform.
Data correspond to usage on the plateform after 2015. The current usage metrics is available 48-96 hours after online publication and is updated daily on week days.
Initial download of the metrics may take a while.