Fig. 2.
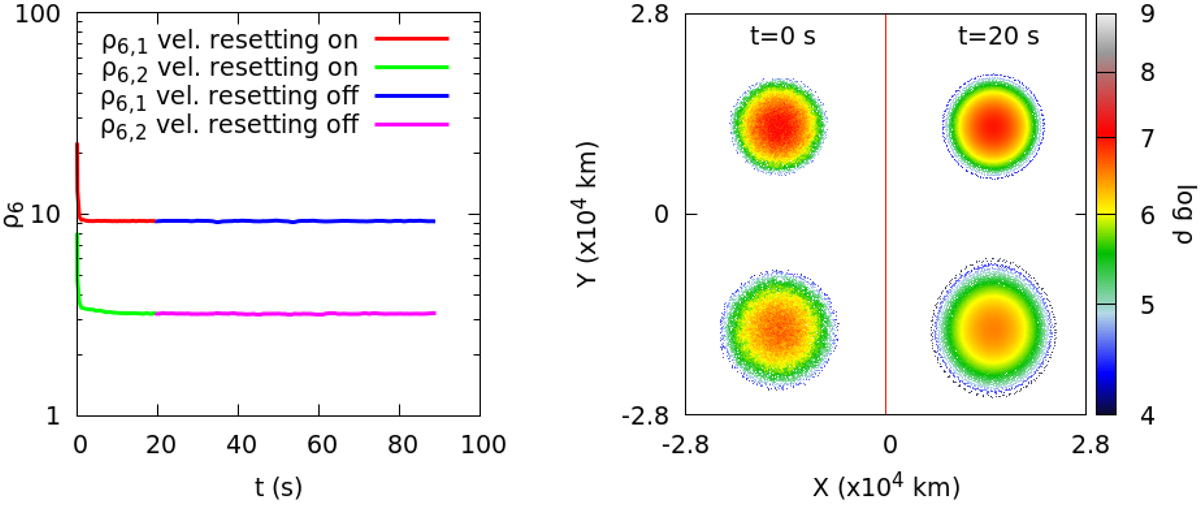
Initial setting of the DD scenario. Left: evolution of the central density of both WDs during the relaxation (t ≤ 20 s) and the free evolving (t ≥ 20 s) stages. The orbital period is P ≃ 70 s. Right: slice in the orbital plane depicting the density color map of each white dwarf at t = 0 s (initial spherically symmetric configuration) and t = 20 s (final relaxed model). The slice has a thickness of four times the local smoothing length value (4 h). The center of mass of both configurations is located at (0, 0) km, but the snapshots have been shifted 14 000 km to the left and to the right to avoid the superposition of the images.
Current usage metrics show cumulative count of Article Views (full-text article views including HTML views, PDF and ePub downloads, according to the available data) and Abstracts Views on Vision4Press platform.
Data correspond to usage on the plateform after 2015. The current usage metrics is available 48-96 hours after online publication and is updated daily on week days.
Initial download of the metrics may take a while.