Fig. 1.
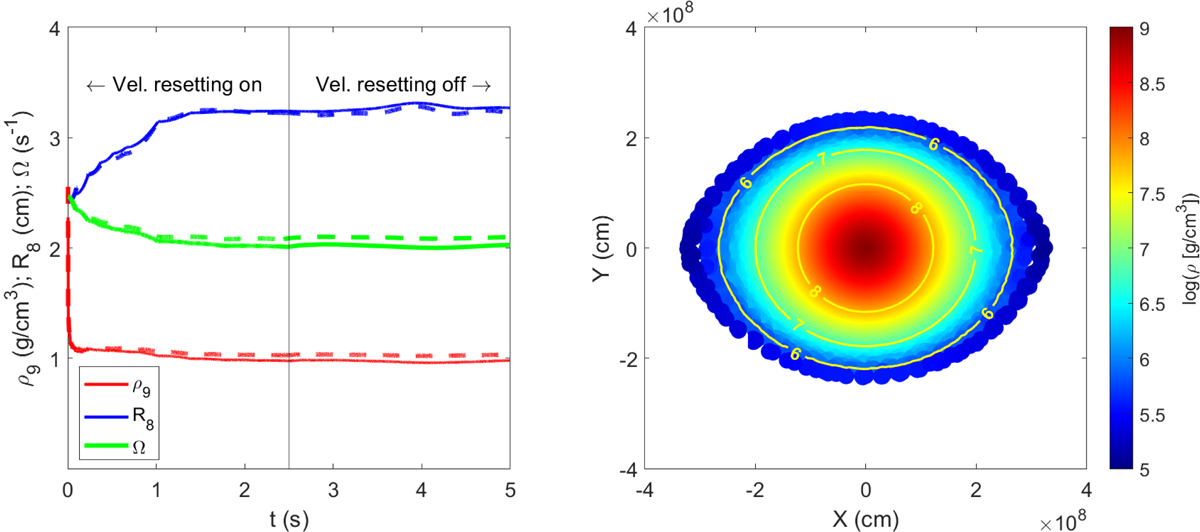
Simulation results of models A21 and A22 in Table 1. Left: evolution of central density (in 109 g cm−3), radius (in 108 cm), and angular velocity Ω. Solid lines correspond to model A21 (5 × 10⁵ particles) and dashed lines to model A22 (2 × 10⁶ particles). Once the periodic resetting to zero of the velocities is removed at t = 2.5 s, the central density remains stable during several sound-crossing times (tsc ≃ 0.4 s). Right: density color map and isodensity contours of a 2D meridional slice of the rotating WD at t = 2.5 s. The slice has a thickness of four times the local smoothing length (4 h), which represents roughly 10% of the total number of particles. Making cuts with the local value of h ensures a similar number of particles at any region of the color map.
Current usage metrics show cumulative count of Article Views (full-text article views including HTML views, PDF and ePub downloads, according to the available data) and Abstracts Views on Vision4Press platform.
Data correspond to usage on the plateform after 2015. The current usage metrics is available 48-96 hours after online publication and is updated daily on week days.
Initial download of the metrics may take a while.