Fig. 9
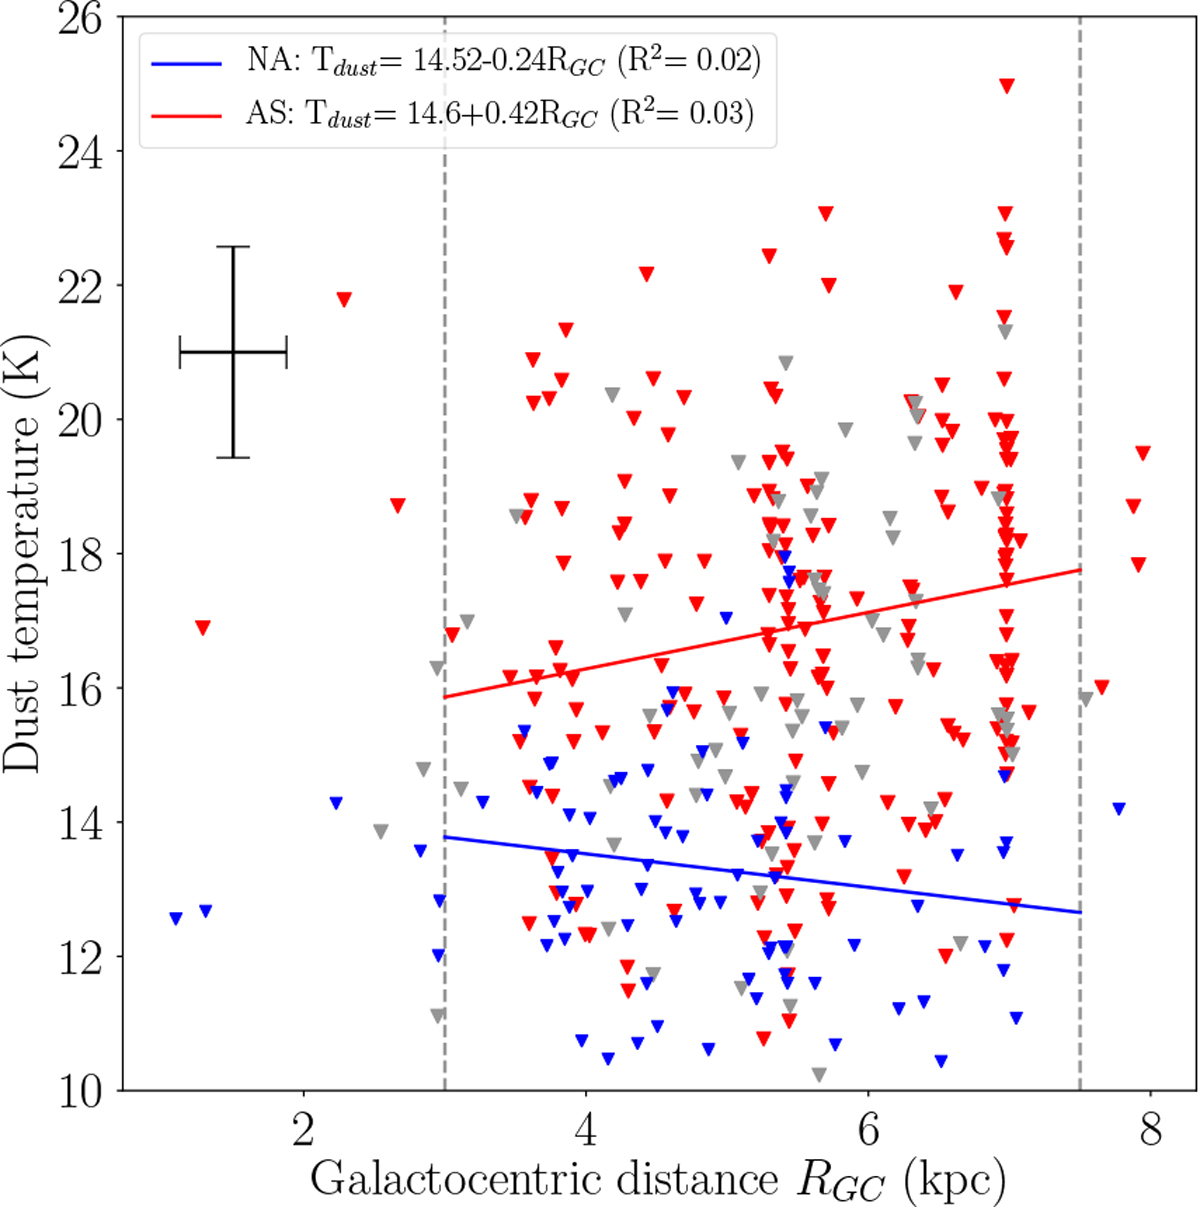
Galactocentric distance RGC and Tdust of HMSCs.Red, gray, and blue dots represent AS, PA, and NA HMSCs, respectively. The typical error is shown as a black cross. The HSMCs used for performing regression and Spearman’s correlations are limited to 3–7.5 kpc. The red and blue solid lines represent the results of linear regressions of AS and NA.
Current usage metrics show cumulative count of Article Views (full-text article views including HTML views, PDF and ePub downloads, according to the available data) and Abstracts Views on Vision4Press platform.
Data correspond to usage on the plateform after 2015. The current usage metrics is available 48-96 hours after online publication and is updated daily on week days.
Initial download of the metrics may take a while.