Fig. 8
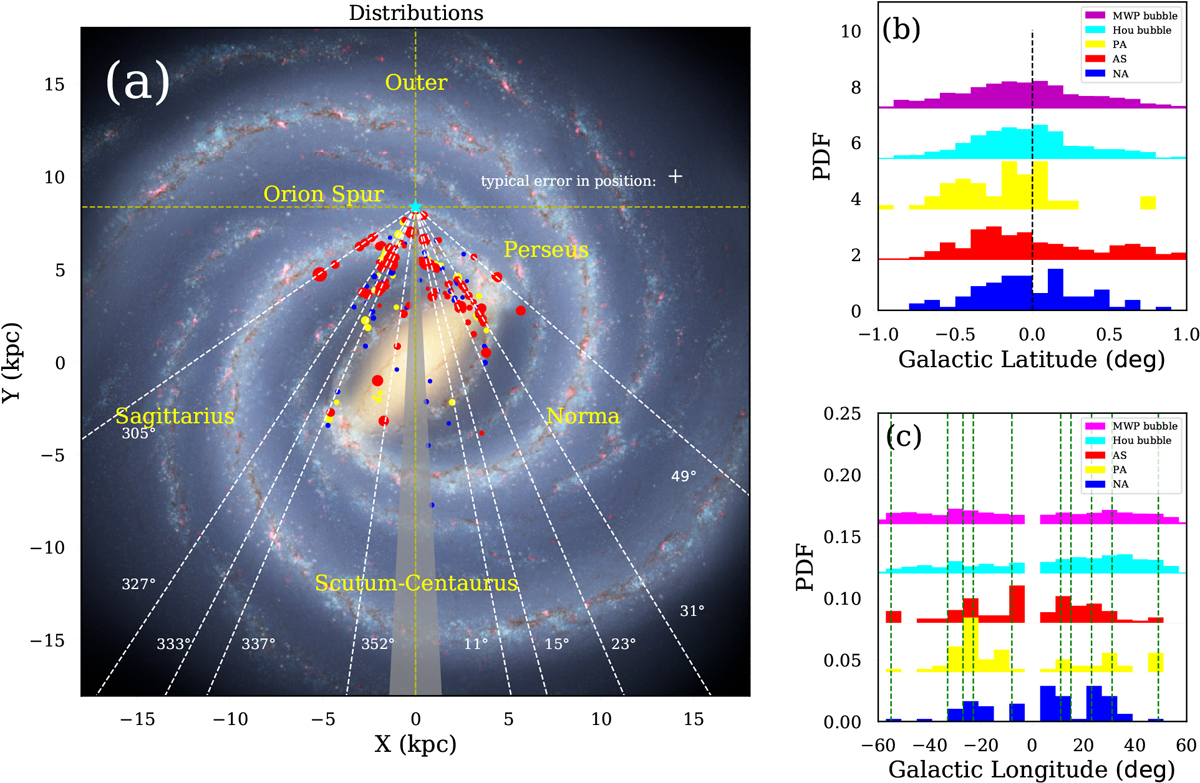
Galactic distributions for different types of HMSCs. Panel a: top view of HMSCs in the Galaxy. The red, yellow, and blue dots represent AS, PA, and NA HMSCs, respectively. The size of the dot increases with Tdust of HMSCs. The gray region represents |l| < 3°. The typical error in position is shown as a white cross. Panels b and c: latitude and longitude distributions for bubble (see Kendrew et al. 2012; Hou & Gao 2014) and different types of HMSCs. The green dashed lines in panel c indicate the tangent directions of the spiral arms, which are shown as white dashed lines in panel a.
Current usage metrics show cumulative count of Article Views (full-text article views including HTML views, PDF and ePub downloads, according to the available data) and Abstracts Views on Vision4Press platform.
Data correspond to usage on the plateform after 2015. The current usage metrics is available 48-96 hours after online publication and is updated daily on week days.
Initial download of the metrics may take a while.