Fig. 7
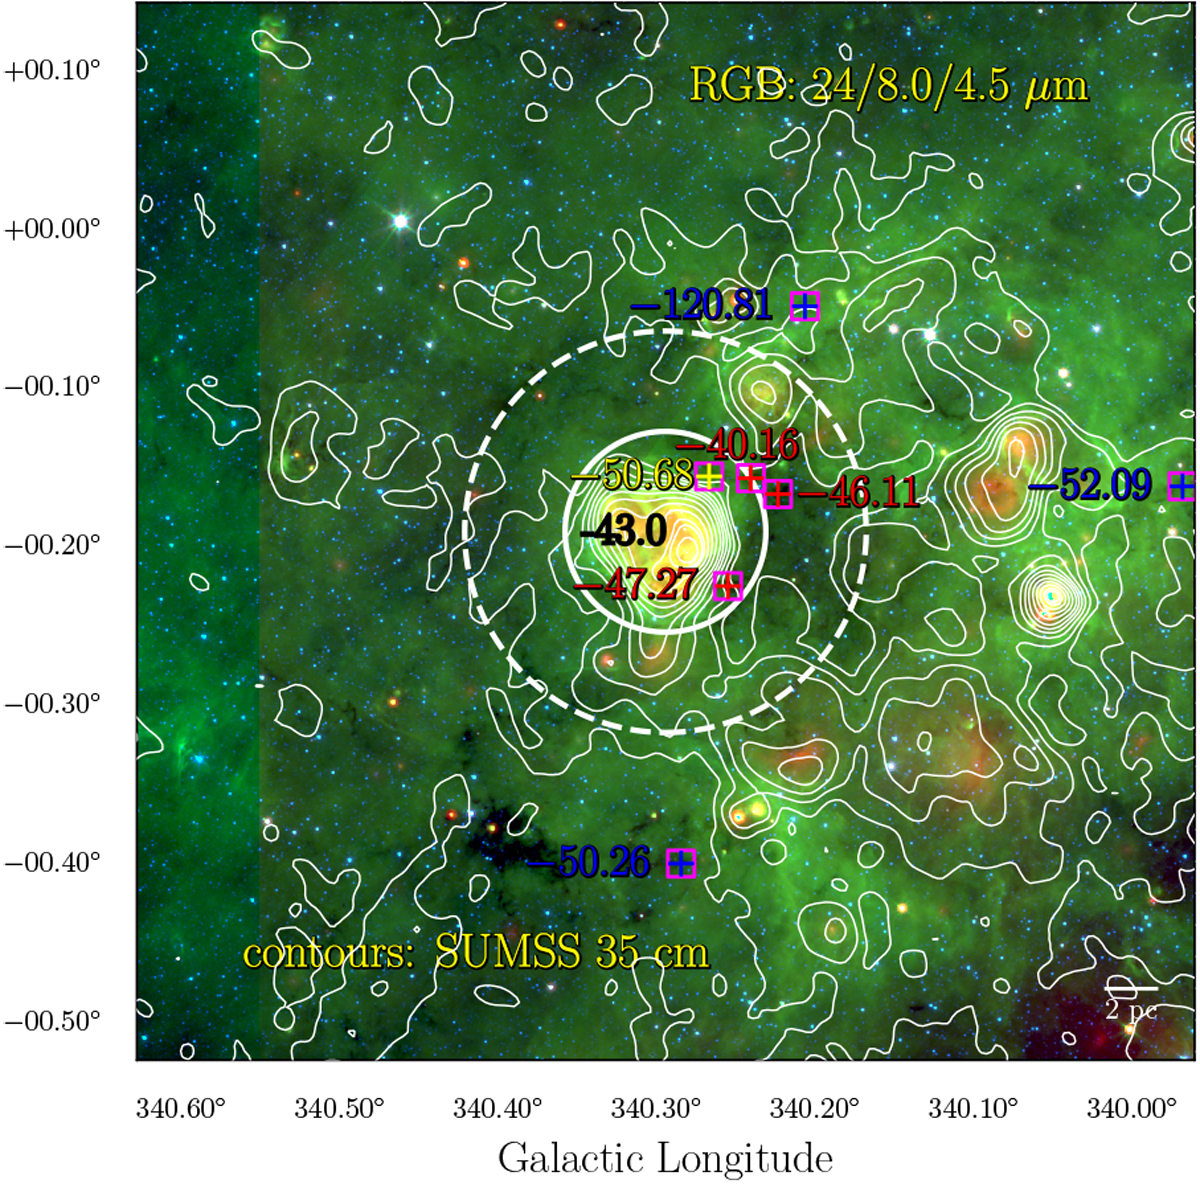
H II region G340.294−00.193. The Reff and 2Reff of the H II region are indicated as solid and dashed white circles, respectively. The purple squares highlight the position of HMSCs. The red, yellow, and blue crosses represent AS, PA, and NA HMSCs, respectively. The corresponding vlsr in km s−1 is shown close to the mark. Number −43.0 is the vlsr of H II region in km s−1. The RGB image is constructed in the same method as Fig. 1. The white contours represent SUMSS 35 cm emission. The vlsr of the H II region is taken from Hou & Gao (2014) and Anderson et al. (2014), see Sect. 4.1.
Current usage metrics show cumulative count of Article Views (full-text article views including HTML views, PDF and ePub downloads, according to the available data) and Abstracts Views on Vision4Press platform.
Data correspond to usage on the plateform after 2015. The current usage metrics is available 48-96 hours after online publication and is updated daily on week days.
Initial download of the metrics may take a while.