Fig. 5
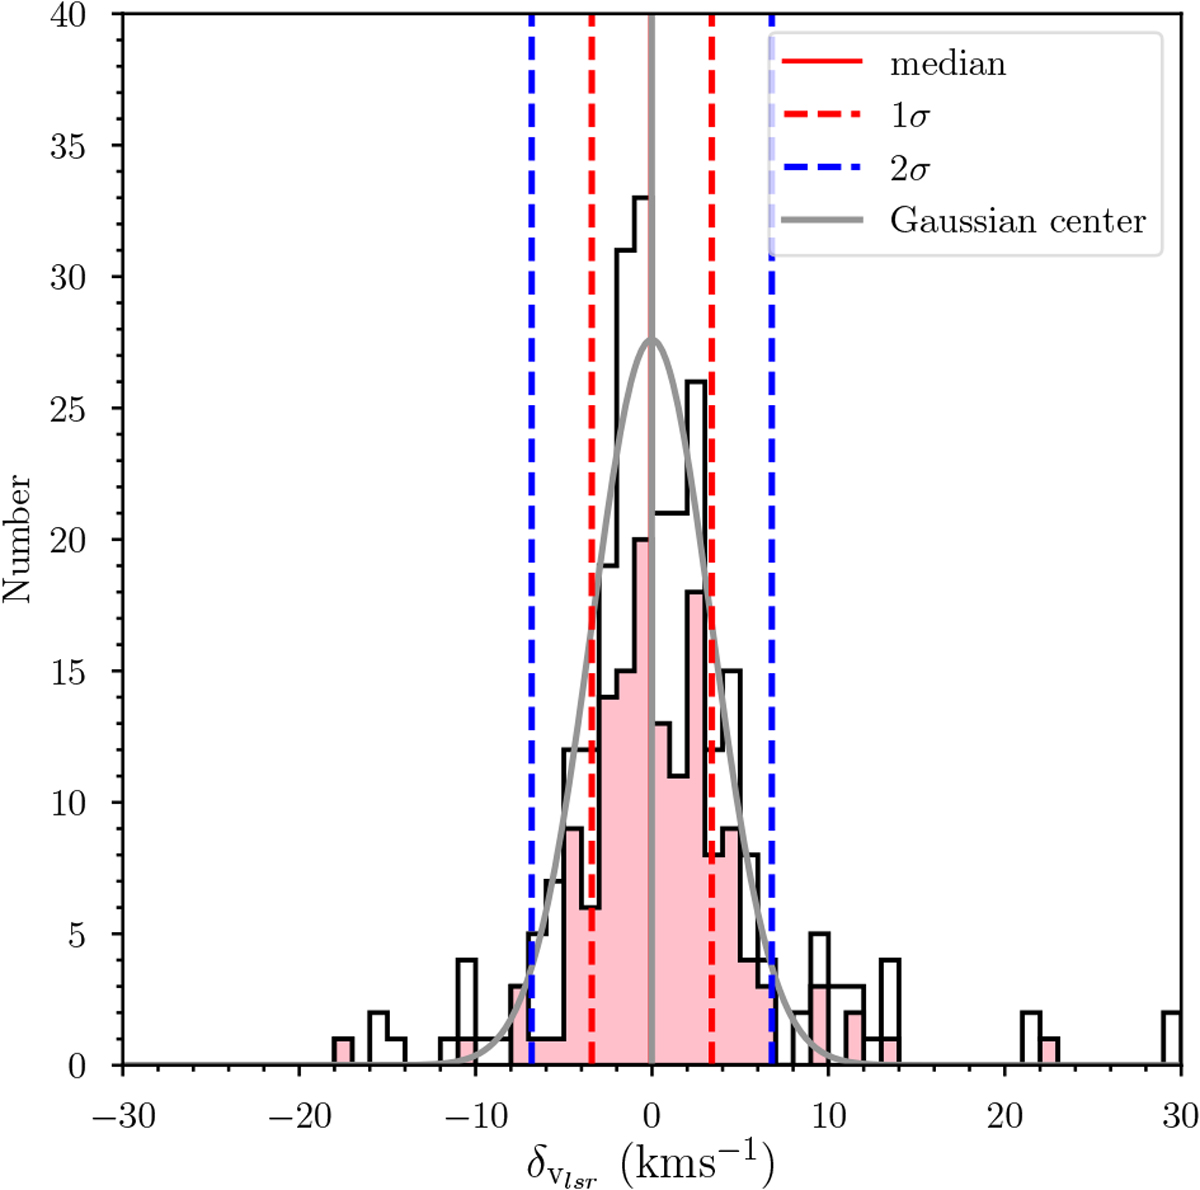
Number distribution of vlsr difference between H II region and HMSC ![]() in the −30 to 30 km s−1
range. The gray lines are the fitted Gaussian and its center. The pink histogram highlights the distribution for S-type HMSCs (see Sect. 4.4). The red and blue dashed lines represent 1 and 2σ
of Gaussian, respectively. The median value of
in the −30 to 30 km s−1
range. The gray lines are the fitted Gaussian and its center. The pink histogram highlights the distribution for S-type HMSCs (see Sect. 4.4). The red and blue dashed lines represent 1 and 2σ
of Gaussian, respectively. The median value of ![]() overlaps with Gaussian center in the figure.
overlaps with Gaussian center in the figure.
Current usage metrics show cumulative count of Article Views (full-text article views including HTML views, PDF and ePub downloads, according to the available data) and Abstracts Views on Vision4Press platform.
Data correspond to usage on the plateform after 2015. The current usage metrics is available 48-96 hours after online publication and is updated daily on week days.
Initial download of the metrics may take a while.